Fig. 3.
Download original image
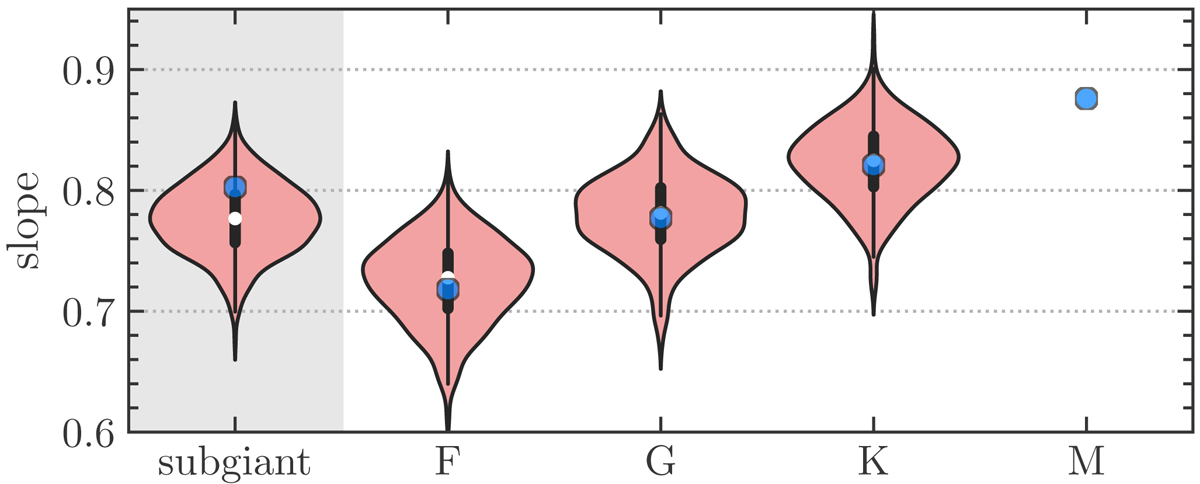
Resampling results for the slope of the σ(Sph) versus ⟨Sph⟩ relation. The smallest subsample corresponds to the M dwarfs with only 426 targets. The resampling was done by randomly selecting 426 targets of the remaining subsamples and was repeated 500 times. For each realization, the multivariate linear regression was performed, and the final distributions for the slope are shown in light red. The thick black bars indicate the first and third quartiles, while the white circles indicate the second quartile. The blue circles indicate the values from the general multivariate regression performed with the full subsamples. The gray region marks the subgiant stars as their temperature does not follow the order of the main-sequence stars: for the dwarfs, Teff increases from right to left.
Current usage metrics show cumulative count of Article Views (full-text article views including HTML views, PDF and ePub downloads, according to the available data) and Abstracts Views on Vision4Press platform.
Data correspond to usage on the plateform after 2015. The current usage metrics is available 48-96 hours after online publication and is updated daily on week days.
Initial download of the metrics may take a while.