Fig. B.8.
Download original image
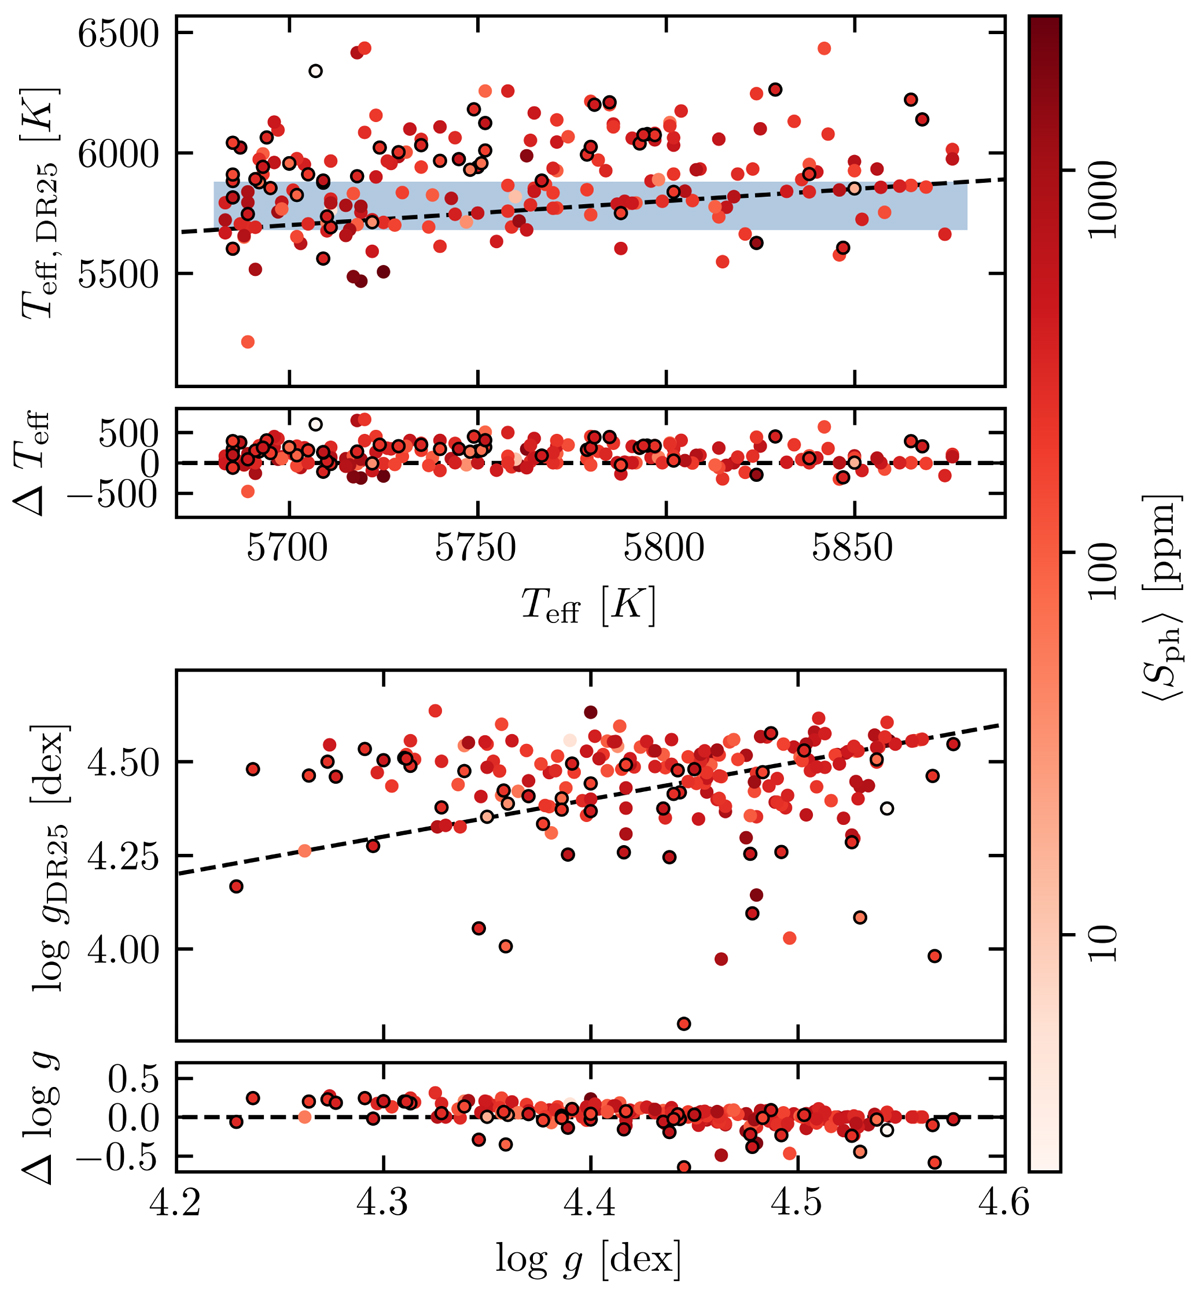
Comparison between the current values for Teff and log g (x-axis) and those from KSPC DR25 (y-axis) for the Sun-like sample. Δ Teff and Δ log g correspond to the difference between previous and current constraints. The data points are colored according to their ⟨Sph⟩. The dashed lines mark the 1-1 lines and the zero difference. The blue shaded region marks the Teff interval we consider in this study to select Sun-like stars.
Current usage metrics show cumulative count of Article Views (full-text article views including HTML views, PDF and ePub downloads, according to the available data) and Abstracts Views on Vision4Press platform.
Data correspond to usage on the plateform after 2015. The current usage metrics is available 48-96 hours after online publication and is updated daily on week days.
Initial download of the metrics may take a while.