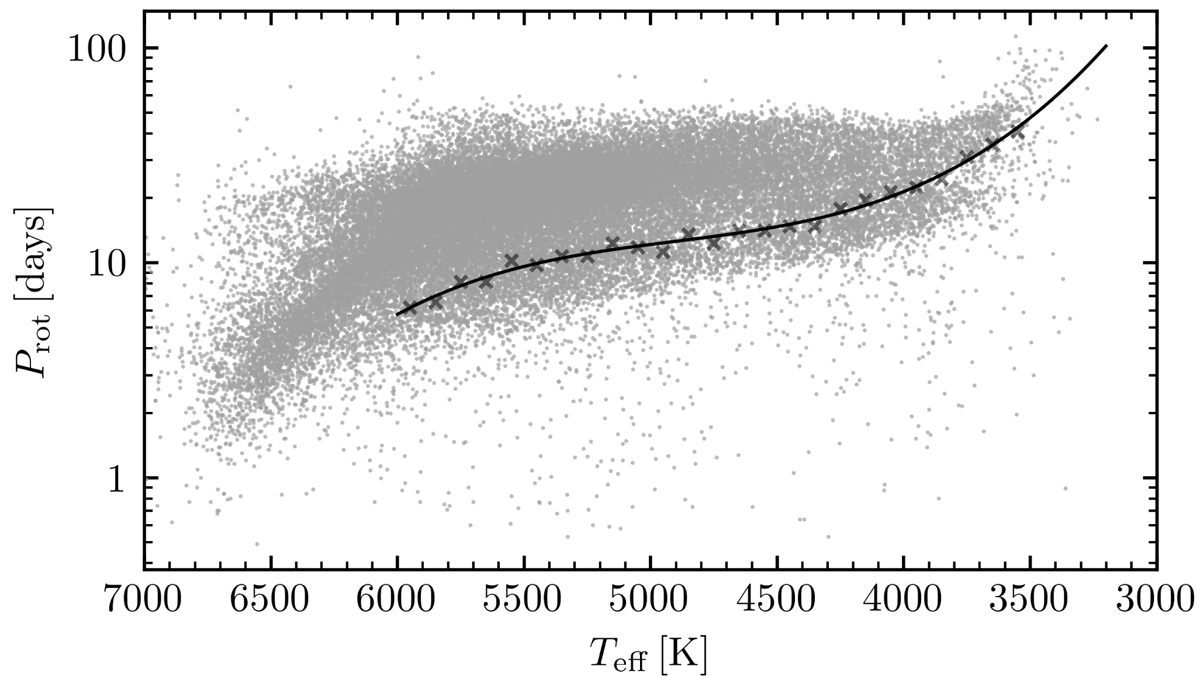
Fig. B.7.
Download original image
Rotation period as a function of the effective temperature for the main-sequence stars in our target sample. The black crosses show the position of the local minimum in the ⟨Sph⟩-Prot diagram for each Teff interval of 100 K (Fig. B.6). The black solid line shows the best fit with a third degree polynomial, which is adopted in this work to split the slow- and fast-rotating populations.
Current usage metrics show cumulative count of Article Views (full-text article views including HTML views, PDF and ePub downloads, according to the available data) and Abstracts Views on Vision4Press platform.
Data correspond to usage on the plateform after 2015. The current usage metrics is available 48-96 hours after online publication and is updated daily on week days.
Initial download of the metrics may take a while.