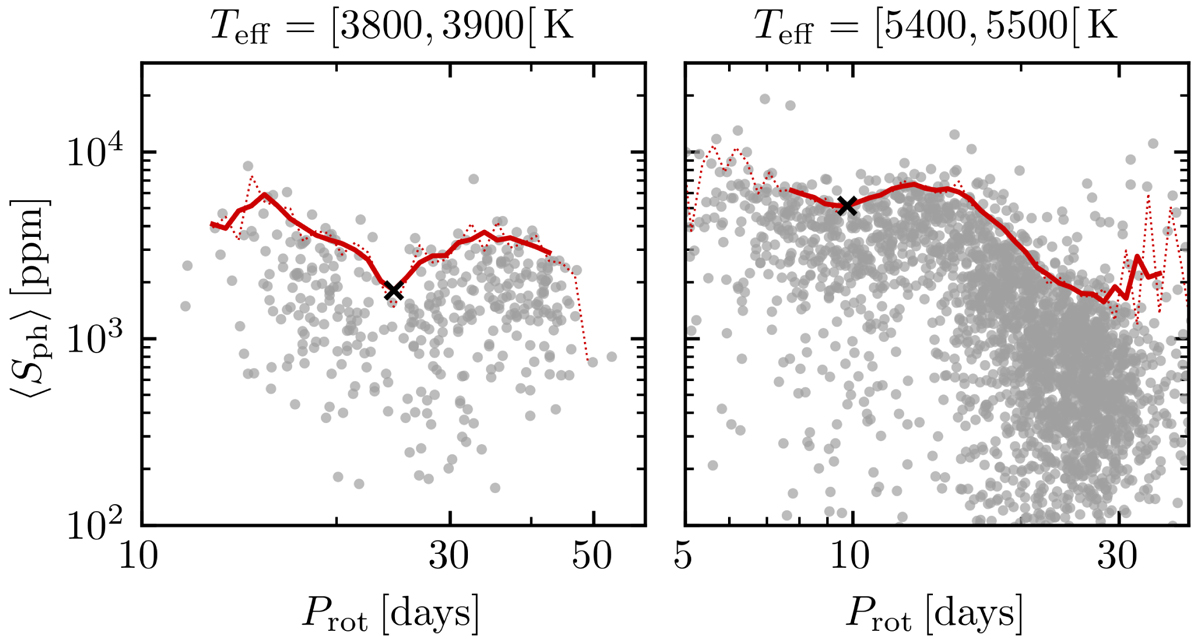
Fig. B.6.
Download original image
Activity-rotation diagram for two intervals of 100 K: 3800-3900 K (left); and 5400-5500 K (right). We use the local minimum (black crosses) to split the sample into fast- and slow-rotating populations. The gray dots show the stars with Teff within the considered interval. The dotted red line shows the upper edge of the ⟨Sph⟩ distribution (95th percentile), while the solid red line shows its smoothed version.
Current usage metrics show cumulative count of Article Views (full-text article views including HTML views, PDF and ePub downloads, according to the available data) and Abstracts Views on Vision4Press platform.
Data correspond to usage on the plateform after 2015. The current usage metrics is available 48-96 hours after online publication and is updated daily on week days.
Initial download of the metrics may take a while.