Fig. A.5.
Download original image
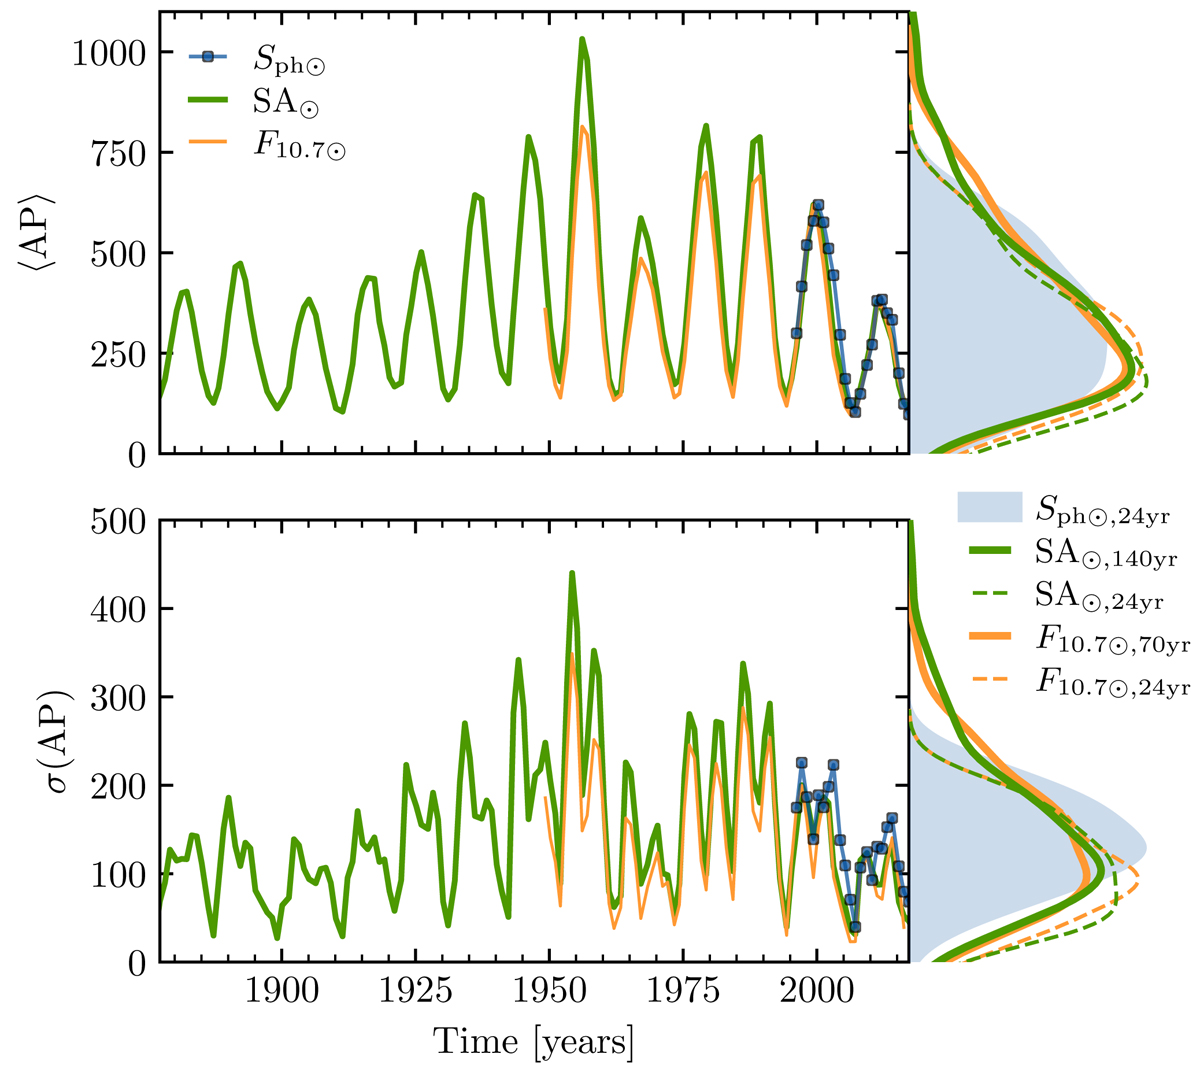
Comparison between the average (top) and standard deviation (bottom) values of the APs computed from 4-year segments. In the left panels, the blue symbols correspond to the Sph⊙, while the green and orange solid lines concern the scaled SA and F10.7, respectively. The right-hand panels show their distributions. “24yr” denotes 24 years, i.e., the two last solar cycles, while “70yr” and “140yr” denote 70 and 140 years.
Current usage metrics show cumulative count of Article Views (full-text article views including HTML views, PDF and ePub downloads, according to the available data) and Abstracts Views on Vision4Press platform.
Data correspond to usage on the plateform after 2015. The current usage metrics is available 48-96 hours after online publication and is updated daily on week days.
Initial download of the metrics may take a while.