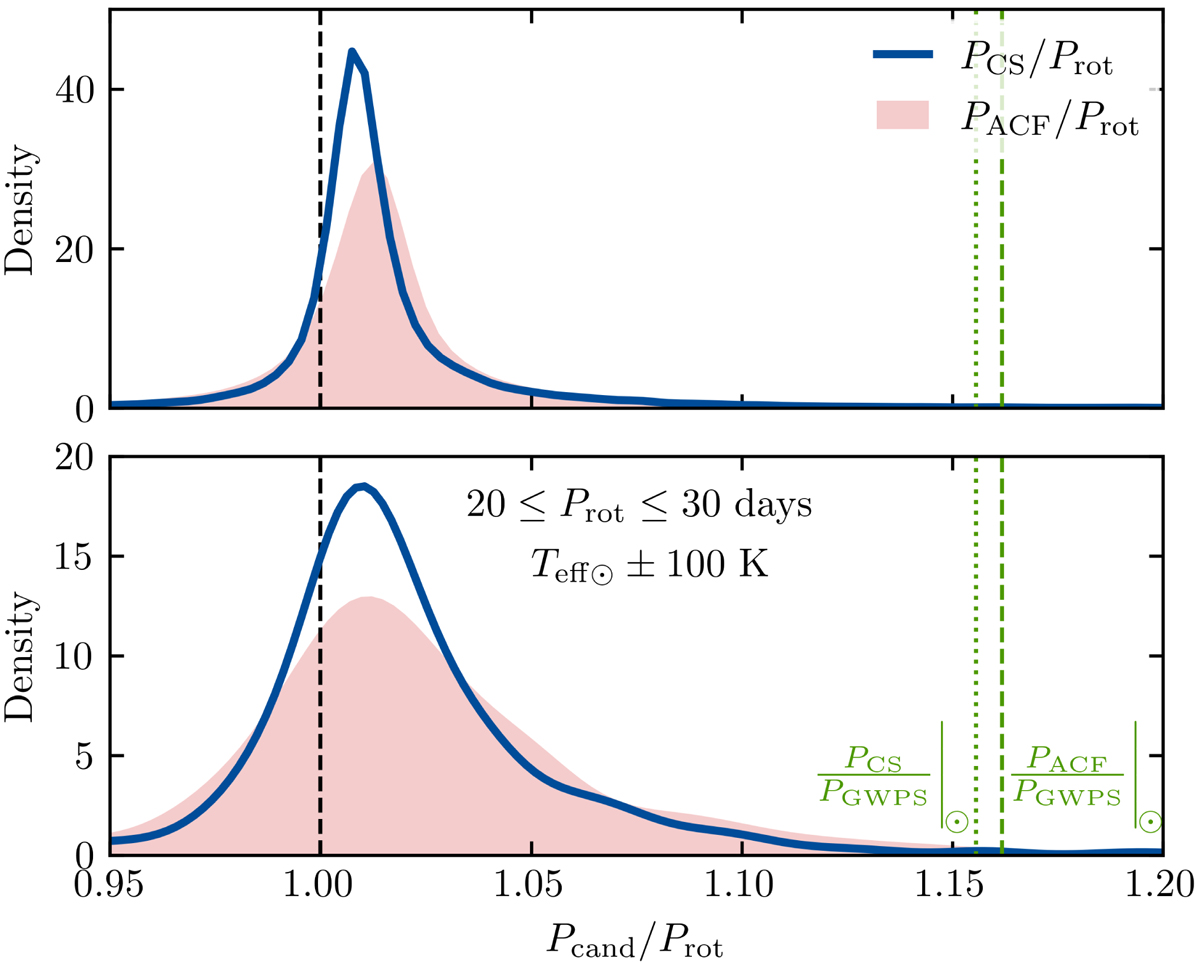
Fig. A.2.
Download original image
Distribution of the ratio between the PACF (red shaded region) or PCS (solid blue line) and the final Prot for Kepler solar-like stars (Santos et al. 2019b, 2021a), where “cand” stands for period candidate. The top panel corresponds to all stars where Pcand are within 30% with respect to Prot. The bottom panel highlights the stars with Prot estimates within 20 and 30 days and Teff around Teff⊙. The black dashed line marks Pcand/Prot = 1 and the green dashed and dotted lines indicate the PACF/PGWPS and PCS/PGWPS for the Sun, respectively.
Current usage metrics show cumulative count of Article Views (full-text article views including HTML views, PDF and ePub downloads, according to the available data) and Abstracts Views on Vision4Press platform.
Data correspond to usage on the plateform after 2015. The current usage metrics is available 48-96 hours after online publication and is updated daily on week days.
Initial download of the metrics may take a while.