Fig. 11.
Download original image
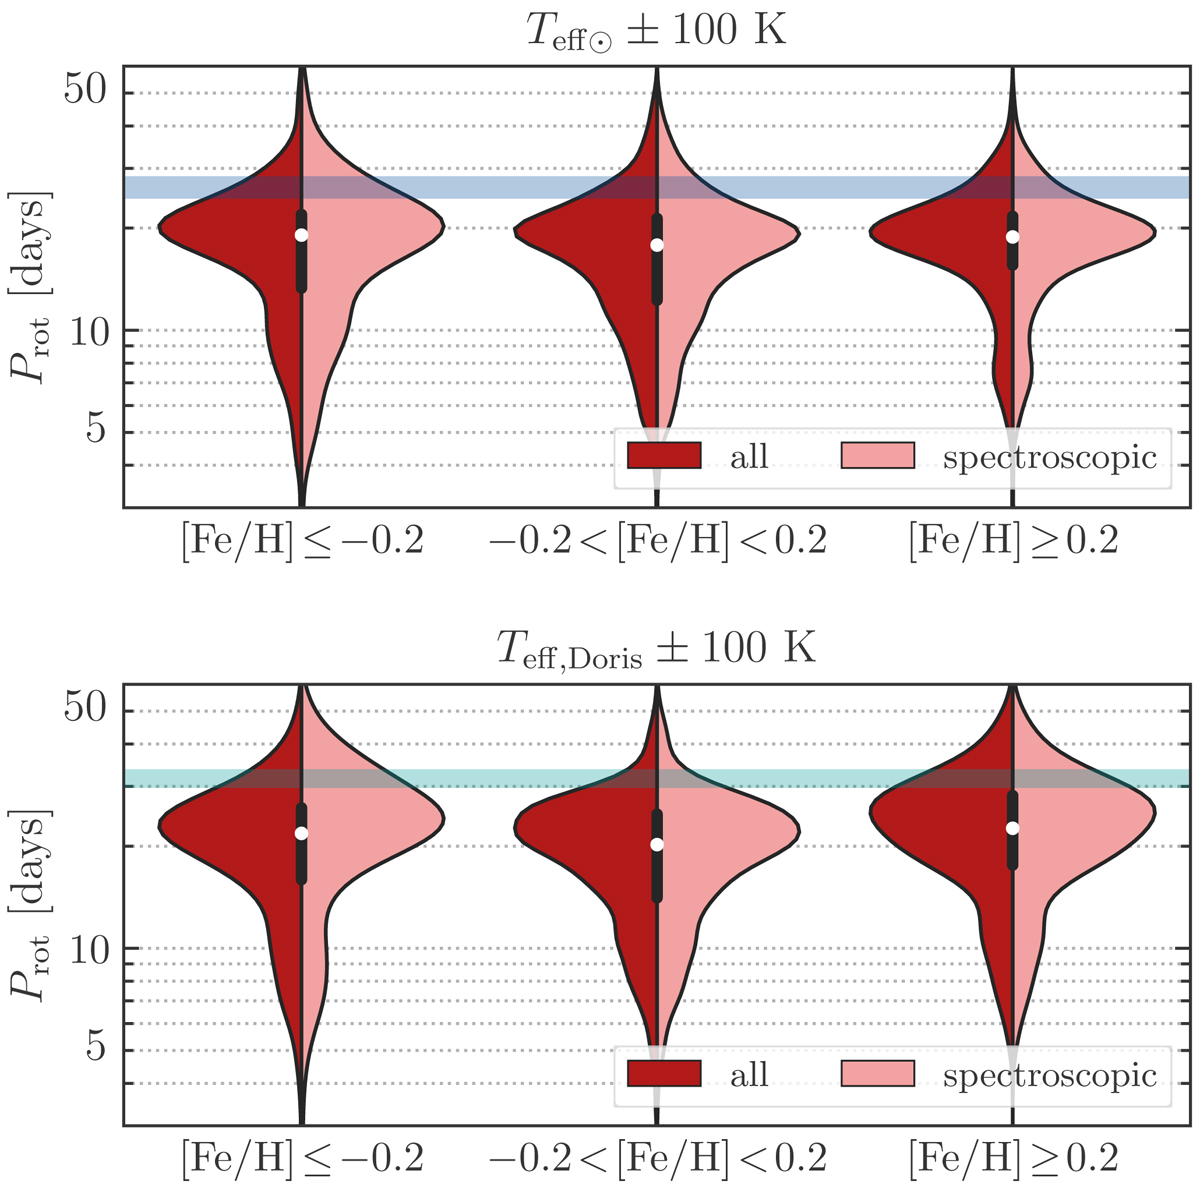
Prot distributions for metal poor (left), solar metallicity (middle), and metal rich (right) stars within 100 K to the Teff of the Sun (top) and Doris (bottom). Dark red shows the distribution for all stars, while light red corresponds to those with spectroscopic parameters. We only consider main-sequence stars. The shaded regions in blue and turquoise mark the Prot interval used to select Sun-like and Doris-like stars. The white circles indicate the median values, while the black bars indicate the 1st and 3rd quartiles of the distributions.
Current usage metrics show cumulative count of Article Views (full-text article views including HTML views, PDF and ePub downloads, according to the available data) and Abstracts Views on Vision4Press platform.
Data correspond to usage on the plateform after 2015. The current usage metrics is available 48-96 hours after online publication and is updated daily on week days.
Initial download of the metrics may take a while.