Fig. 5.
Download original image
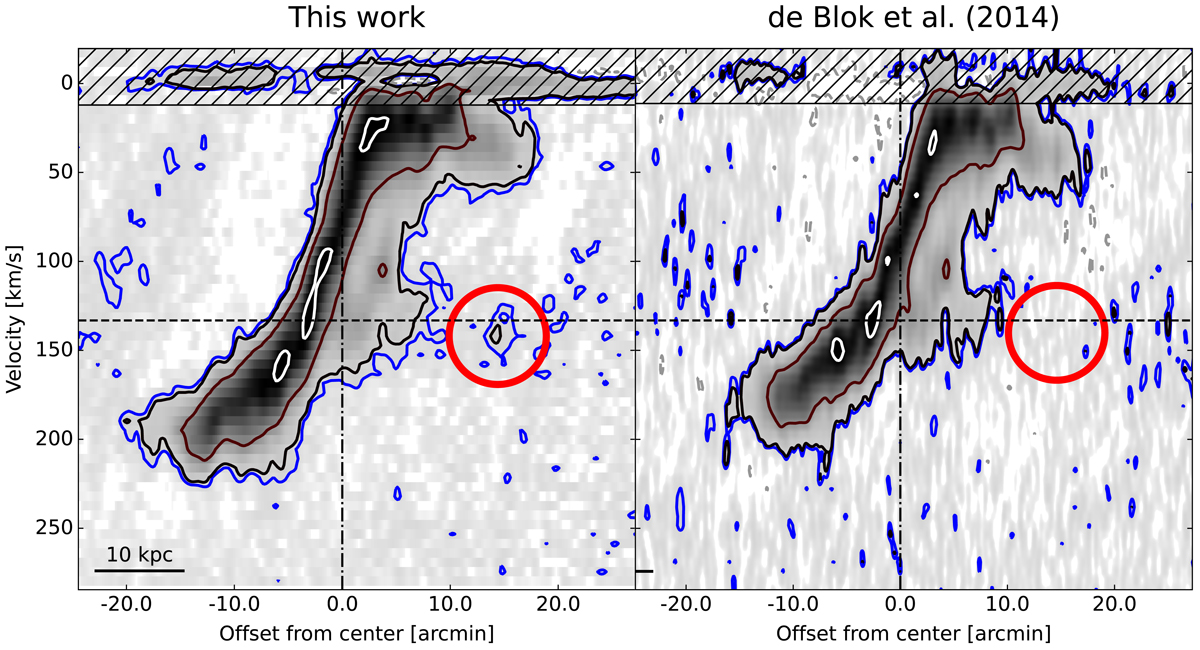
Comparison between the position–velocity diagram through the centres of the cloud candidate and the 20 kpc filament along a 100″-thick slice as taken through our data (left panel) and as shown in Fig. 6 in de Blok et al. (2014) (right panel). The emission is mapped with a reverse grey scale and we overlaid the 2.5 × (1, 9, 81) × 1018 cm−2 column density levels with colour-scale contours (black, red and white, respectively). The blue contour denotes a level of 1.2 × 1018 cm−2 and highlights the detection of the 20 kpc filament tip with the combination of the new and archival VLA data. The red circles highlight the tip of the 20 kpc filament which was not detected in the Fraternali et al. (2002) and de Blok et al. (2014) analyses.
Current usage metrics show cumulative count of Article Views (full-text article views including HTML views, PDF and ePub downloads, according to the available data) and Abstracts Views on Vision4Press platform.
Data correspond to usage on the plateform after 2015. The current usage metrics is available 48-96 hours after online publication and is updated daily on week days.
Initial download of the metrics may take a while.