Fig. 4.
Download original image
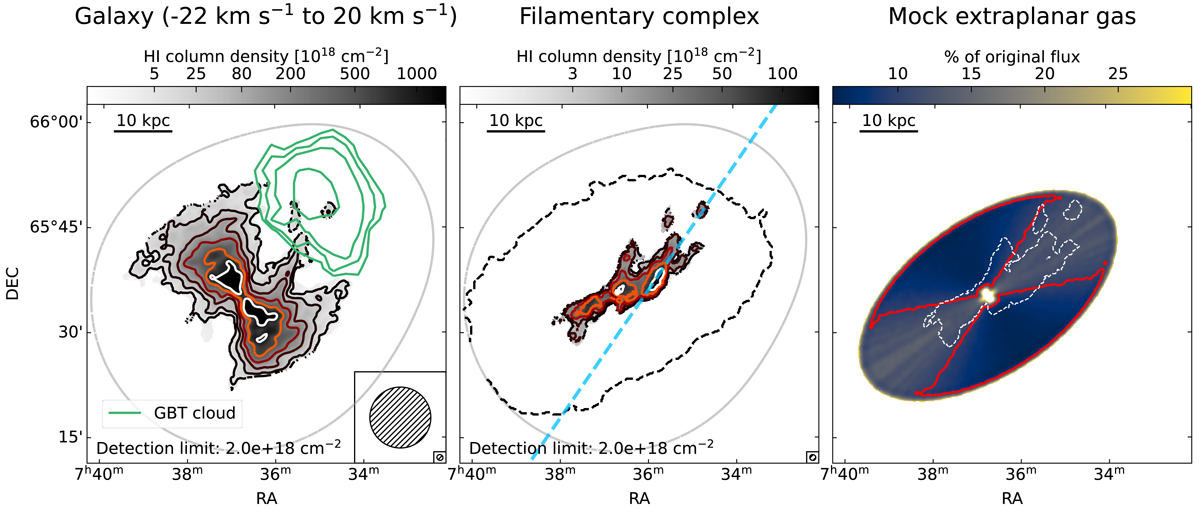
Left panel: primary-beam-corrected H I column density map of NGC 2403 (in reverse grey-scale colourmap) overlaid with the GBT cloud candidate (green) from de Blok et al. (2014). The map was produced by integrating over the channels from −22 km s−1 to 20 km s−1 with respect to the systemic velocity. This range corresponds to the one used by de Blok et al. (2014) to compute the candidate GBT cloud moment-zero map. Grey-scale contour levels are from 5 × 1018 cm−2 to 1 × 1021 cm−2. The 3σ one-channel column-density limit is reported at the bottom. The beam of the interferometric data for both the GBT and our VLA observations is shown in the bottom right. The green contours instead define the (6.25, 12.5, 25, 62.5) – 1017 cm−2 column density in the GBT data. The light-grey line denotes the 20% cut-off threshold of the primary beam response. Central panel: primary-beam-corrected H I column-density map of the anomalous-velocity gas. Grey-scale contour levels are (3, 10, 25, 50, 100) × 1018 cm−2 column density. The spatial scale is the same as in the left panel, and the light grey line shows the same cut-off threshold. We indicate the galaxy edge with the dashed-black contour. The light blue dashed line represents the path along which the position-velocity slice has been extracted (see Fig. 5). Right panel: illustrative example of the selection effect introduced by the shuffle procedure (see discussion in Sect. 4). The map shows the fraction of the original extraplanar flux density of a mock galaxy we were able to recover and the red contour encloses the region where we are severely affected by selection effect, i.e., where more than 90% of the original flux density is lost. The blanked bits in the centre denote the region where the result is unreliable because of the steep gradient in velocity. The dashed white contours indicate the region occupied by the observed filamentary complex.
Current usage metrics show cumulative count of Article Views (full-text article views including HTML views, PDF and ePub downloads, according to the available data) and Abstracts Views on Vision4Press platform.
Data correspond to usage on the plateform after 2015. The current usage metrics is available 48-96 hours after online publication and is updated daily on week days.
Initial download of the metrics may take a while.