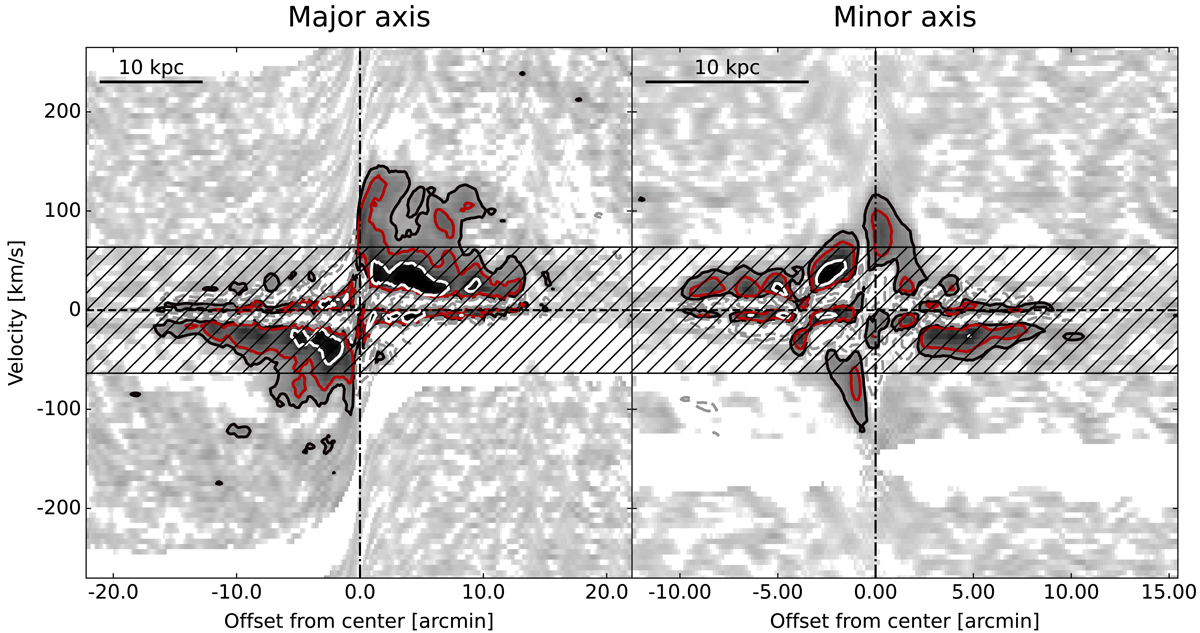
Fig. 3.
Download original image
Position–velocity diagram along the major axis (left panel) and minor axis (right panel) through a beam-wide slice of the shuffled data cube without the thin-disk removal. The emission is mapped with a reverse grey scale and we overlaid the 2 × (1, 3, 9) × 1018 cm−2 levels with grey-scale contours. The blanked area in the top left and blank stripe in the bottom are the result of the Milky Way filtering. The grey dashed lines denote the column density of −3σ. The channels between ±65 km s−1 with the residual thin disk and diffuse extraplanar emission are highlighted with the hatched area; they were not used for the computation of the moment map shown in the central panel of Fig. 4.
Current usage metrics show cumulative count of Article Views (full-text article views including HTML views, PDF and ePub downloads, according to the available data) and Abstracts Views on Vision4Press platform.
Data correspond to usage on the plateform after 2015. The current usage metrics is available 48-96 hours after online publication and is updated daily on week days.
Initial download of the metrics may take a while.