Fig. 2.
Download original image
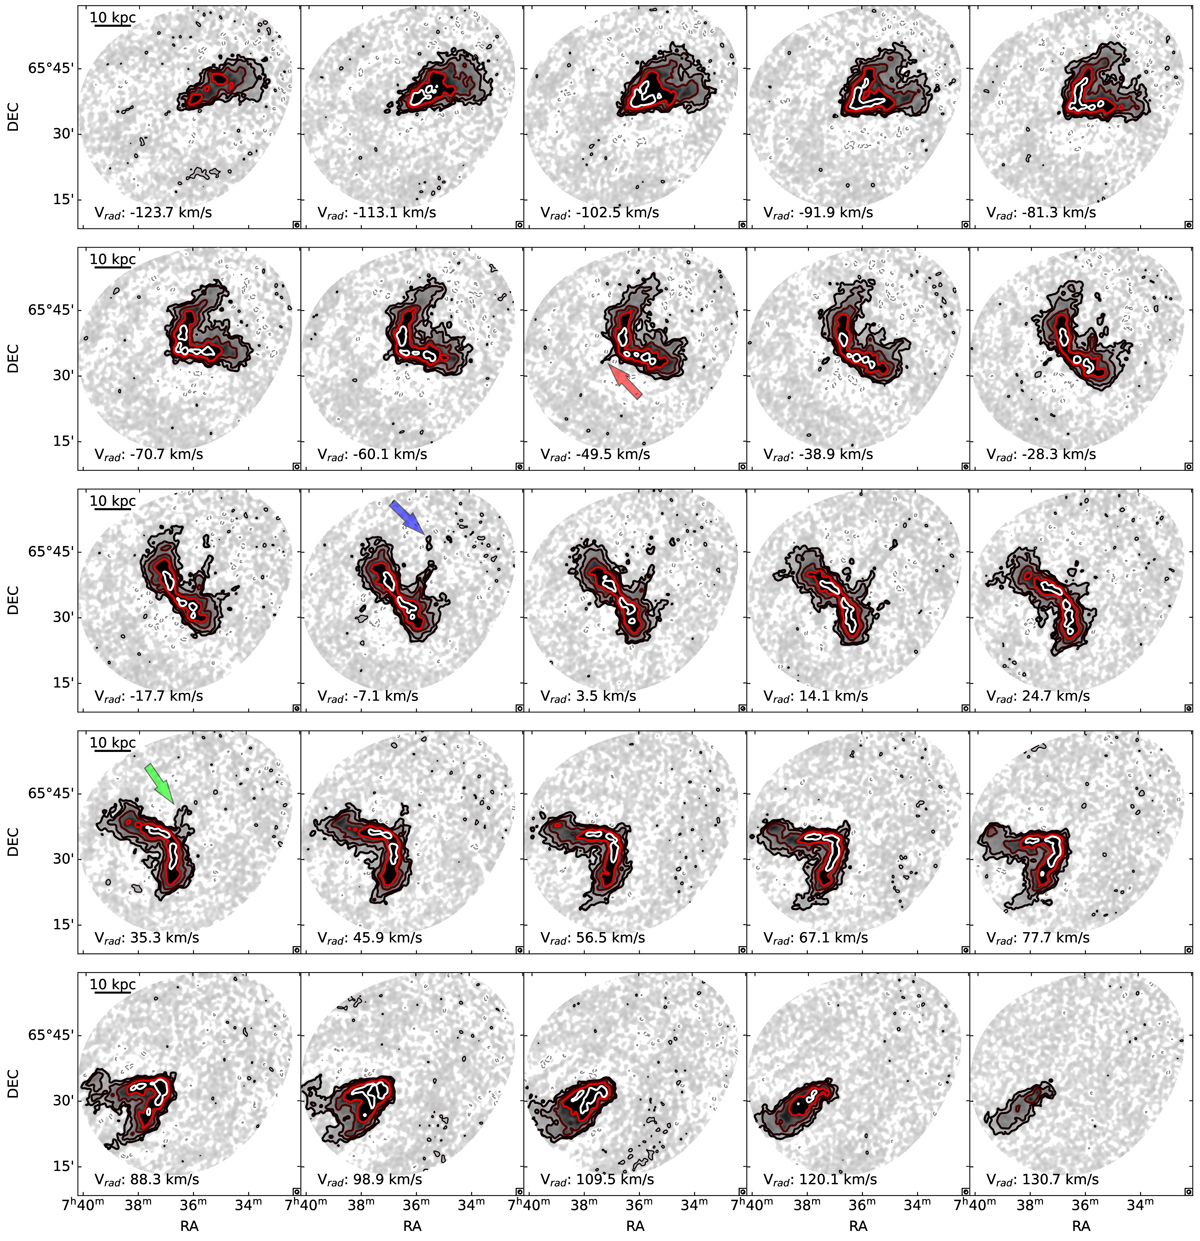
NGC 2403 H I channel maps of the data cube with both new and archival observations where we show only every second channel. The colour-scale contours correspond to 2 × (1, 4, 16, 64) × 1018 cm−2, where 2 × 1018 cm−2 is the 3σ one-channel column density limit. The thick contour levels indicate the significant emission identified by the SoFiA source finder. Most of the low-level structures shown in thin contours are noise or mosaicking artefacts. The dashed grey contours denote the column density of −2 × 1018 cm−2. The egg-shaped borders are due to the 20% cut-off threshold of the primary beam response. At the bottom, we report the line-of-sight velocity (with respect to the systemic velocity 133.2 km s−1) in each channel. The filamentary detections, labelled with coloured arrows, are evident between −59 km s−1 and 47 km s−1.
Current usage metrics show cumulative count of Article Views (full-text article views including HTML views, PDF and ePub downloads, according to the available data) and Abstracts Views on Vision4Press platform.
Data correspond to usage on the plateform after 2015. The current usage metrics is available 48-96 hours after online publication and is updated daily on week days.
Initial download of the metrics may take a while.