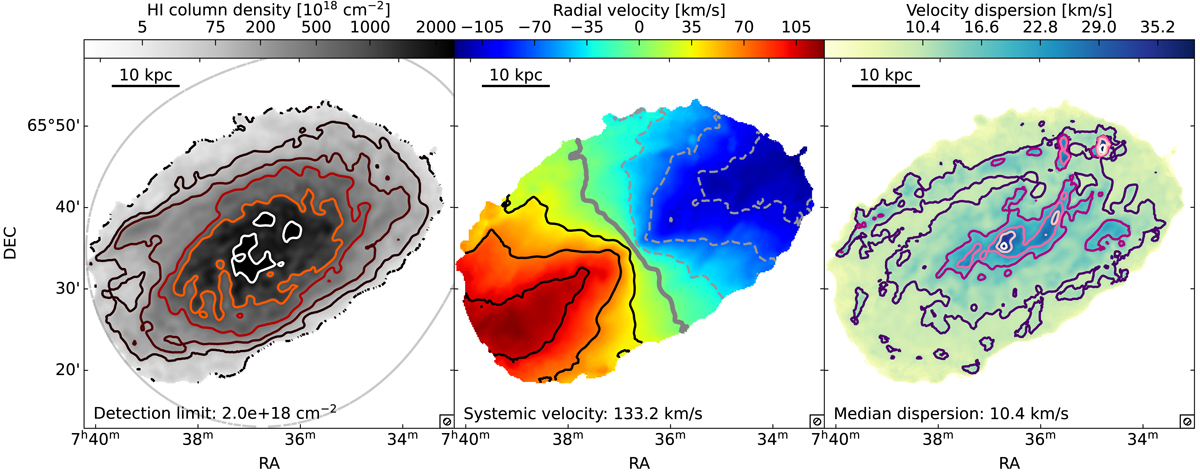
Fig. 1.
Download original image
NGC 2403 moment maps. Left panel: primary-beam-corrected H I column-density map of NGC 2403 with reversed grey-scale colour map from faint (grey) to bright (black) emission. The sharp cut-off in the bottom left is due to the 20% cut-off threshold of the primary beam response, which is illustrated with the light grey curve. The contours levels are (5, 75, 200, 500, 1000, 2000) × 1018 cm−2. The column density limit 3 × σ × dv = 2 × 1018 cm−2, where dv = 5.3 km s−1 is the spectral resolution, is reported at the bottom. In the bottom right we show the 52″ × 49″ beam. Central panel: intensity-weighted mean velocity field of NGC 2403 with respect to the systemic velocity of 133.2 km s−1, given at the bottom. Dashed contours (−105, −70, −35) km s−1 refer to the approaching side, while solid lines correspond to radial velocities of (35, 70, 105) km s−1. The thick grey line is the kinematical minor axis. Right panel: second moment map, where the signature of the filaments with their anomalous velocities is visible in the increased second-moment values.
Current usage metrics show cumulative count of Article Views (full-text article views including HTML views, PDF and ePub downloads, according to the available data) and Abstracts Views on Vision4Press platform.
Data correspond to usage on the plateform after 2015. The current usage metrics is available 48-96 hours after online publication and is updated daily on week days.
Initial download of the metrics may take a while.