Open Access
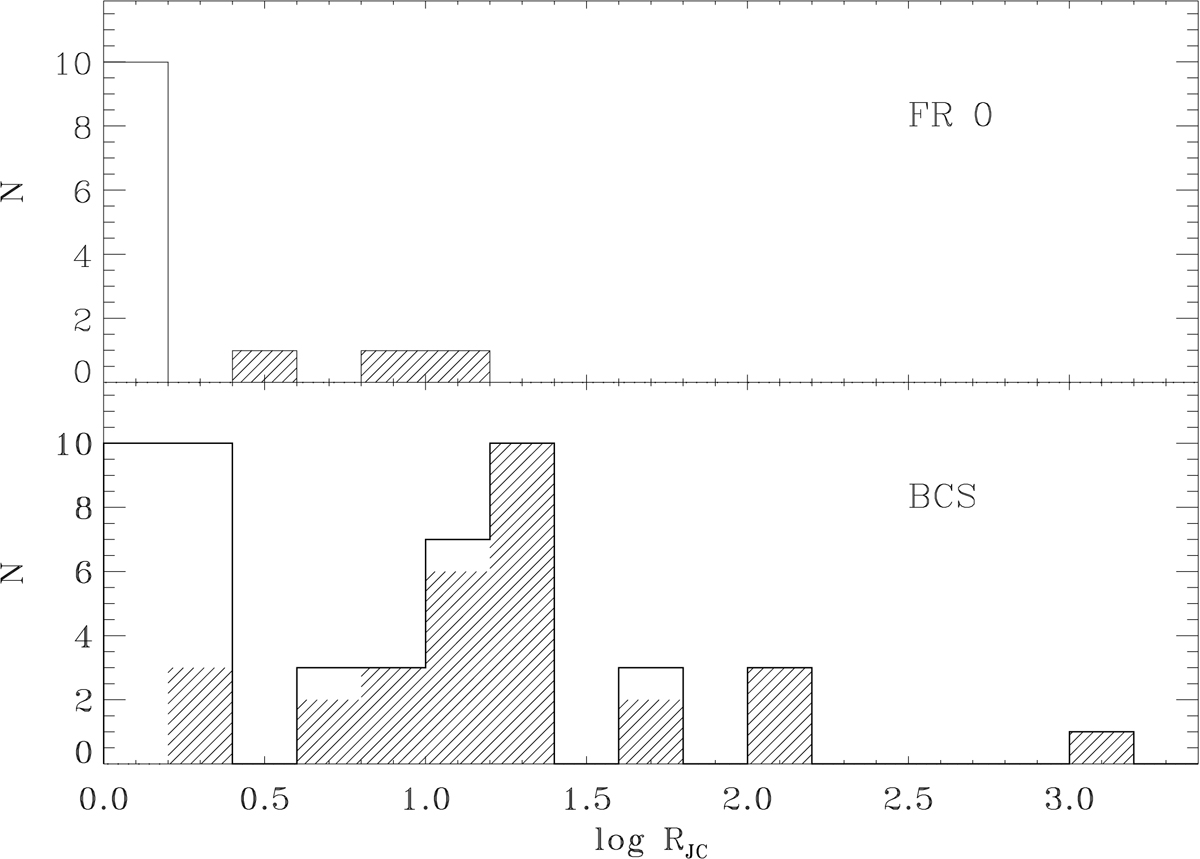
Fig. 16.
Download original image
Distributions of the logarithm of the ratio RJC between the flux densities of the jet and counter-jet for the FR0s (top panel) and the source in the BCS sample (bottom panel). The dashed portions of the histograms correspond to lower limits on RJC.
Current usage metrics show cumulative count of Article Views (full-text article views including HTML views, PDF and ePub downloads, according to the available data) and Abstracts Views on Vision4Press platform.
Data correspond to usage on the plateform after 2015. The current usage metrics is available 48-96 hours after online publication and is updated daily on week days.
Initial download of the metrics may take a while.