Fig. 7

Download original image
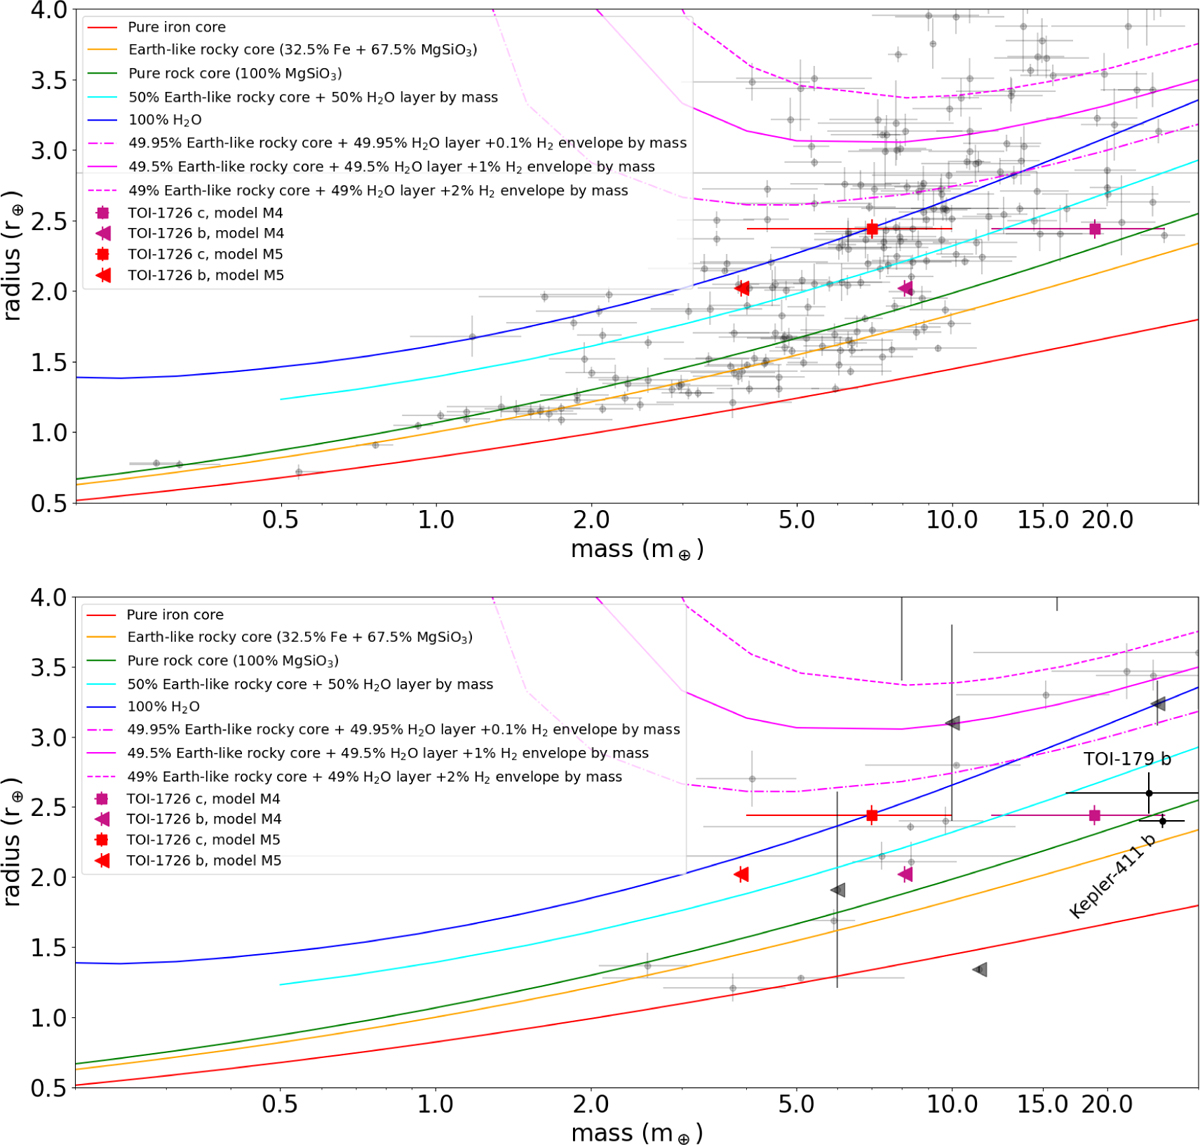
Upper panel: Mass-radius diagram for exoplanets selected from the TEPCAT sample, available at https://www.astro.keele.ac.uk/jkt/tepcat/ (updated to 7 October 2022; Southworth 2011). Black dots represent planets with mass and radius measured with a relative precision lower than 30%and 10%, respectively. Planets of the HD63433 system are indicated by reddish triangles (planet b), which denote mass upper limits, and squares (planet c), with reference to the corresponding models listed in Table 2. Theoretical curves for some planet compositions are overplotted, as calculated by Zeng et al. (2019) assuming 1 milli-bar surface pressure. Models for a planet with an H2O-gaseous atmosphere (50% and 100% H2O by mass, cyan and blue curves, respectively), and for a planet with different percentages of an H2 gaseous envelope over a 50% water-rich layer (magenta curves) are calculated for an isothermal fluid/steam envelope equilibrium temperature of 700 K, similar to that of HD 63433 c (680±12 K). Lower panel: Mass-radius diagram for planets with age < 900 Myr. Triangles are used to identify planets for which only mass upper limits are available. No selection is made based on the precision of mass and radius measurements. We used Desidera et al. (2023) as a reference for the mass and radius of TOI-179 b.
Current usage metrics show cumulative count of Article Views (full-text article views including HTML views, PDF and ePub downloads, according to the available data) and Abstracts Views on Vision4Press platform.
Data correspond to usage on the plateform after 2015. The current usage metrics is available 48-96 hours after online publication and is updated daily on week days.
Initial download of the metrics may take a while.


