Fig. 8.
Download original image
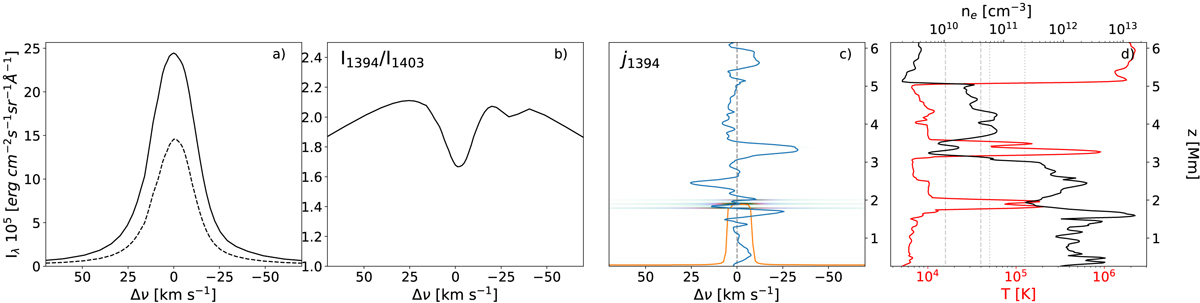
Si IV formation diagram in the pixel marked by a white circle in Fig. 4. The panels show (a) Line profiles of Si IV 1394 Å (solid black) and Si IV 1403 Å (dashed black). (b) Intensity ratio of Si IV 1394 Å and Si IV 1403 Å lines. (c) Emissivity j of the 1394 Å line (Eq. (4), j0.6) and vertical velocity vz (blue). The vertical dashed line indicates where Δv = 0 km s−1. The orange line marks the height at which τ = 1 is reached. (d) Gas temperature T (red) and electron density ne (black) of Si IV. The dashed vertical lines represents the LTE Si IV formation temperature interval and the dotted vertical lines represent the coronal equilibrium formation temperature interval. Positive Δν indicates an upwards velocity.
Current usage metrics show cumulative count of Article Views (full-text article views including HTML views, PDF and ePub downloads, according to the available data) and Abstracts Views on Vision4Press platform.
Data correspond to usage on the plateform after 2015. The current usage metrics is available 48-96 hours after online publication and is updated daily on week days.
Initial download of the metrics may take a while.