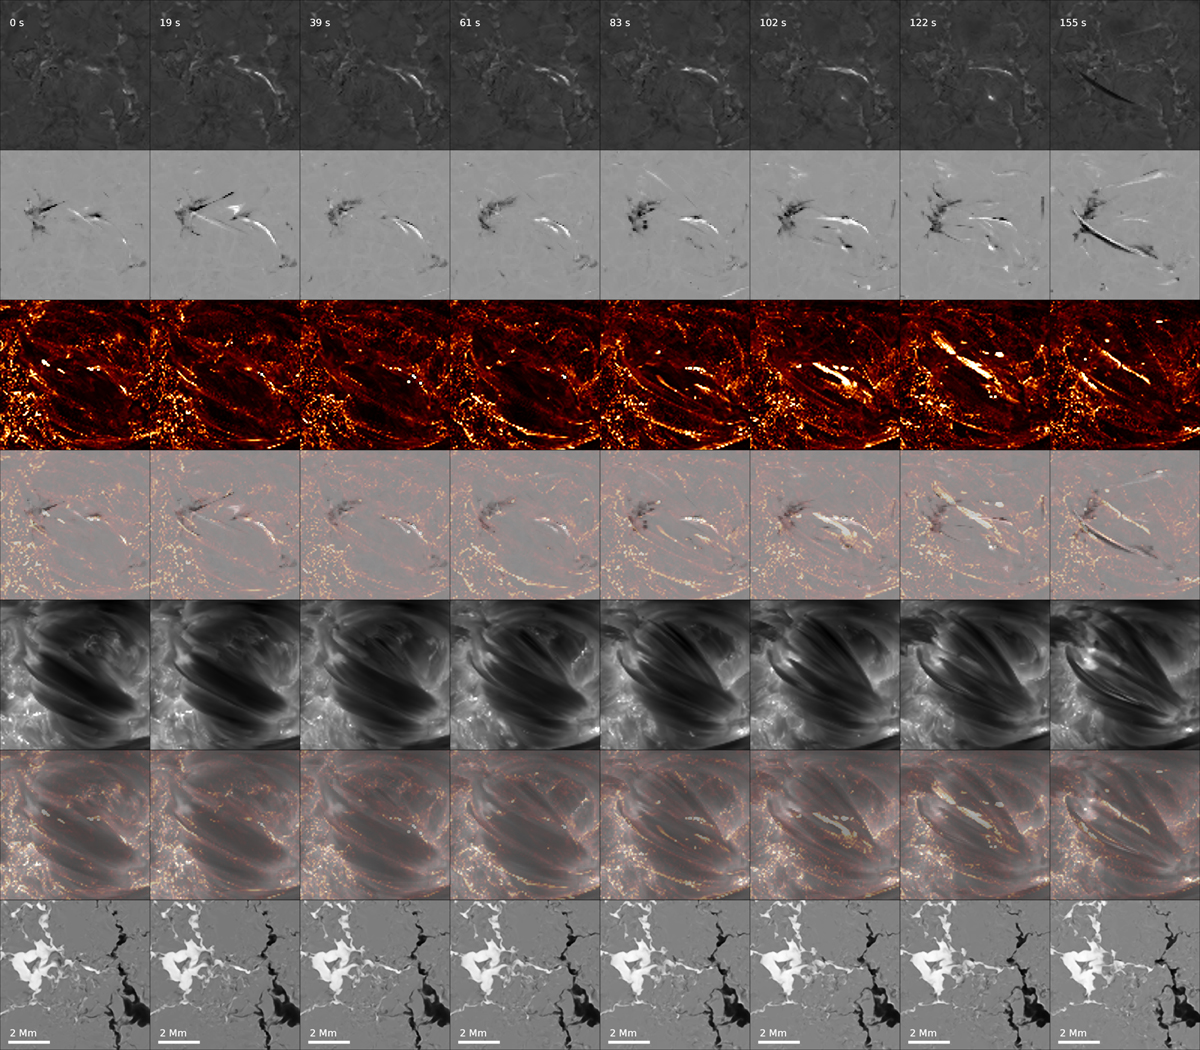
Fig. 3.
Download original image
Time evolution of the synthetic loop at μ = 1. From the top to the bottom: normalised Hα blue wing intensity at vD = 53 km s−1, Hα Dopplergram at velocities ±53 km s−1 (black and white represent red and blue wings, respectively), Si IV 1393 Å summed over frequencies ±0.79 Å around line centre, composite image of the Hα Dopplergram (black and white) and frequency-summed Si IV (orange), Hα line core, composite image of Hα line core and frequency-summed Si IV and vertical magnetic field (black and white represent downward and upward magnetic field, respectively).
Current usage metrics show cumulative count of Article Views (full-text article views including HTML views, PDF and ePub downloads, according to the available data) and Abstracts Views on Vision4Press platform.
Data correspond to usage on the plateform after 2015. The current usage metrics is available 48-96 hours after online publication and is updated daily on week days.
Initial download of the metrics may take a while.