Open Access
Fig. 2.
Download original image
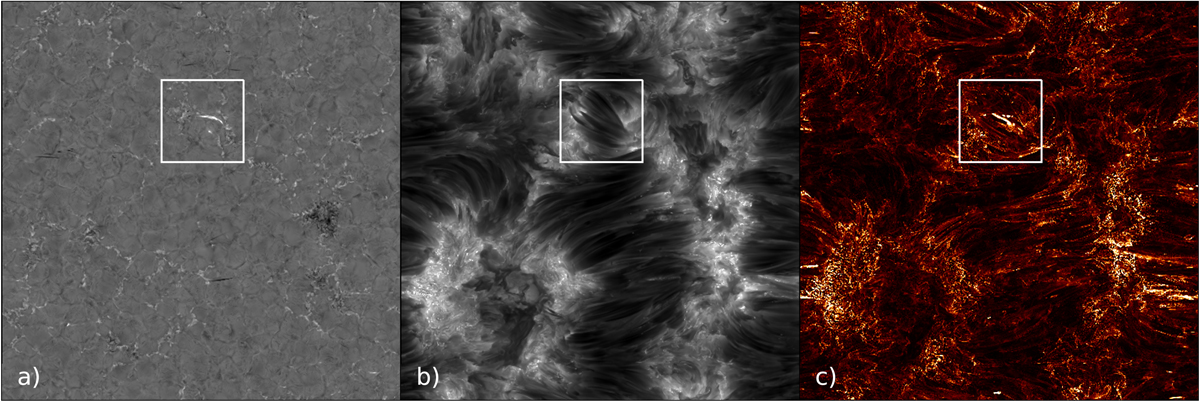
Synthetic observables over the full FOV at μ = 1, t = 102 s. The box shows the selected subfield in Fig. 3. In panel a we plot the blue wing of Hα, (b) the Hα line core intensity, and (c) Si IV summed over all frequencies ±0.79 Å around the line centre.
Current usage metrics show cumulative count of Article Views (full-text article views including HTML views, PDF and ePub downloads, according to the available data) and Abstracts Views on Vision4Press platform.
Data correspond to usage on the plateform after 2015. The current usage metrics is available 48-96 hours after online publication and is updated daily on week days.
Initial download of the metrics may take a while.