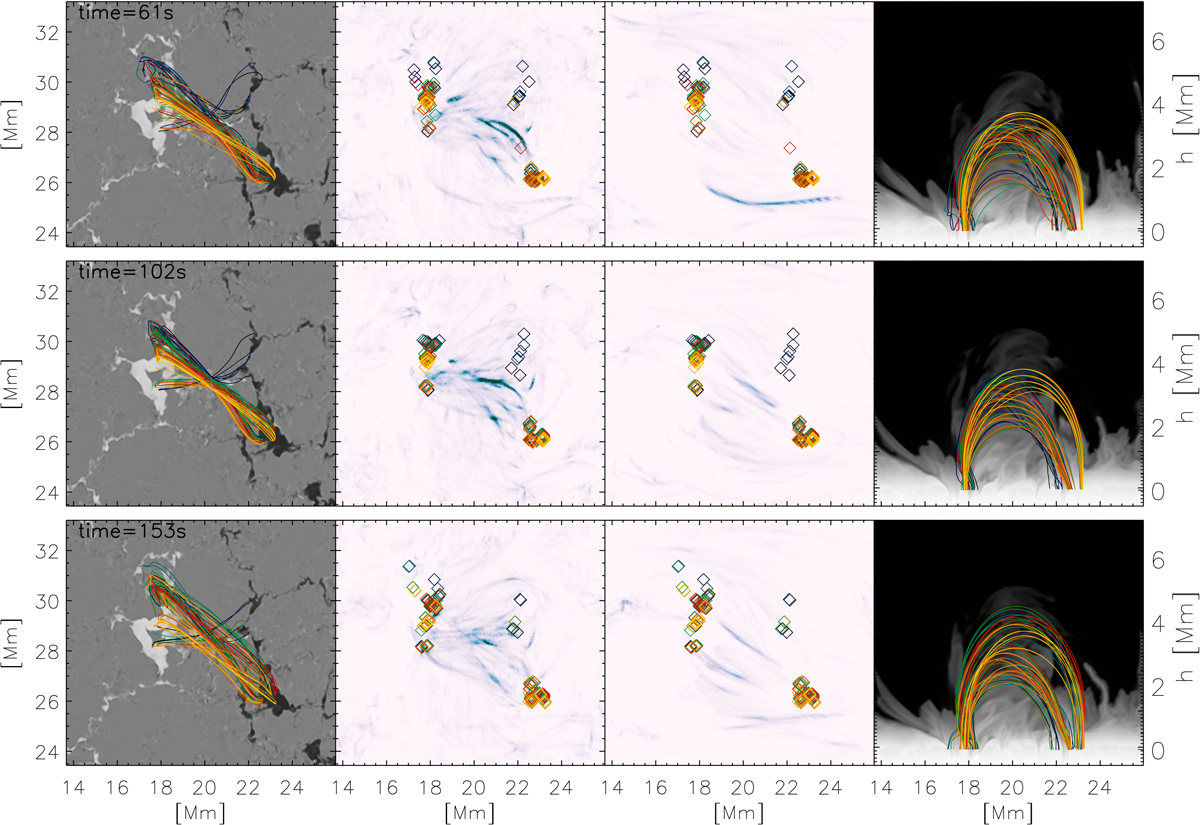
Fig. 16.
Download original image
Evolution of traced magnetic field lines. On the left, traced magnetic field lines are plotted over the vertical component of the photospheric magnetic field. In the middle, the position of the corresponding footpoints is marked over the sum of resistive and viscous heating terms integrated over the height range [0.6 − 3.8] Mm (second column) and [2.7 − 7] Mm (third column). On the right, we show the projection of the traced field lines to the z-axis. The background shows density along the horizontal cut at y = 28 Mm. The movie is available online.
Current usage metrics show cumulative count of Article Views (full-text article views including HTML views, PDF and ePub downloads, according to the available data) and Abstracts Views on Vision4Press platform.
Data correspond to usage on the plateform after 2015. The current usage metrics is available 48-96 hours after online publication and is updated daily on week days.
Initial download of the metrics may take a while.