Open Access
Fig. 13.
Download original image
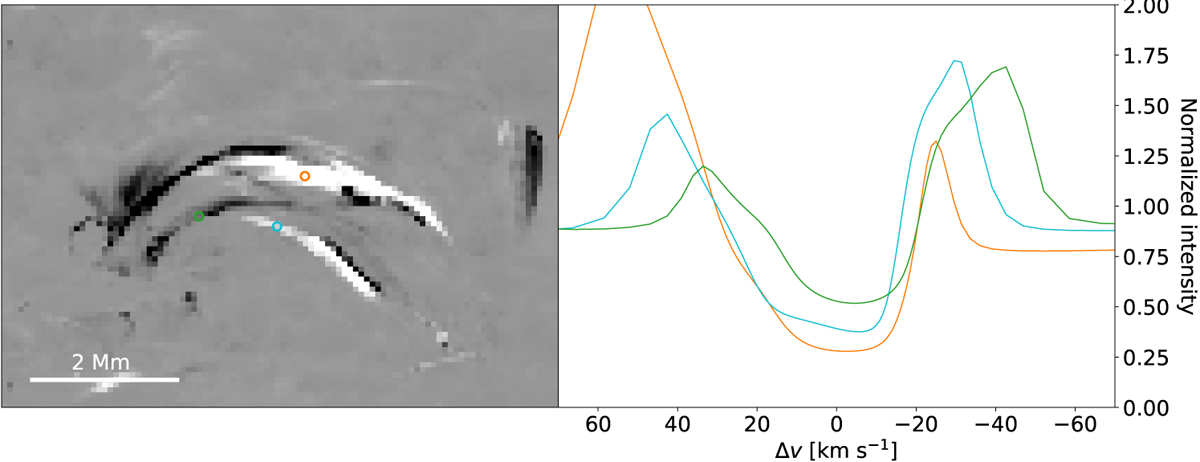
Diagram showing the line profiles of Hα at μ = 0.66. Left: loop in synthetic Hα at μ = 0.66 at t = 102 s, where three chosen pixels are indicated by circles in green, orange, and blue. Right: normalised Hα intensity for the pixels indicated with the respective colour in the left panel.
Current usage metrics show cumulative count of Article Views (full-text article views including HTML views, PDF and ePub downloads, according to the available data) and Abstracts Views on Vision4Press platform.
Data correspond to usage on the plateform after 2015. The current usage metrics is available 48-96 hours after online publication and is updated daily on week days.
Initial download of the metrics may take a while.