Fig. 1.
Download original image
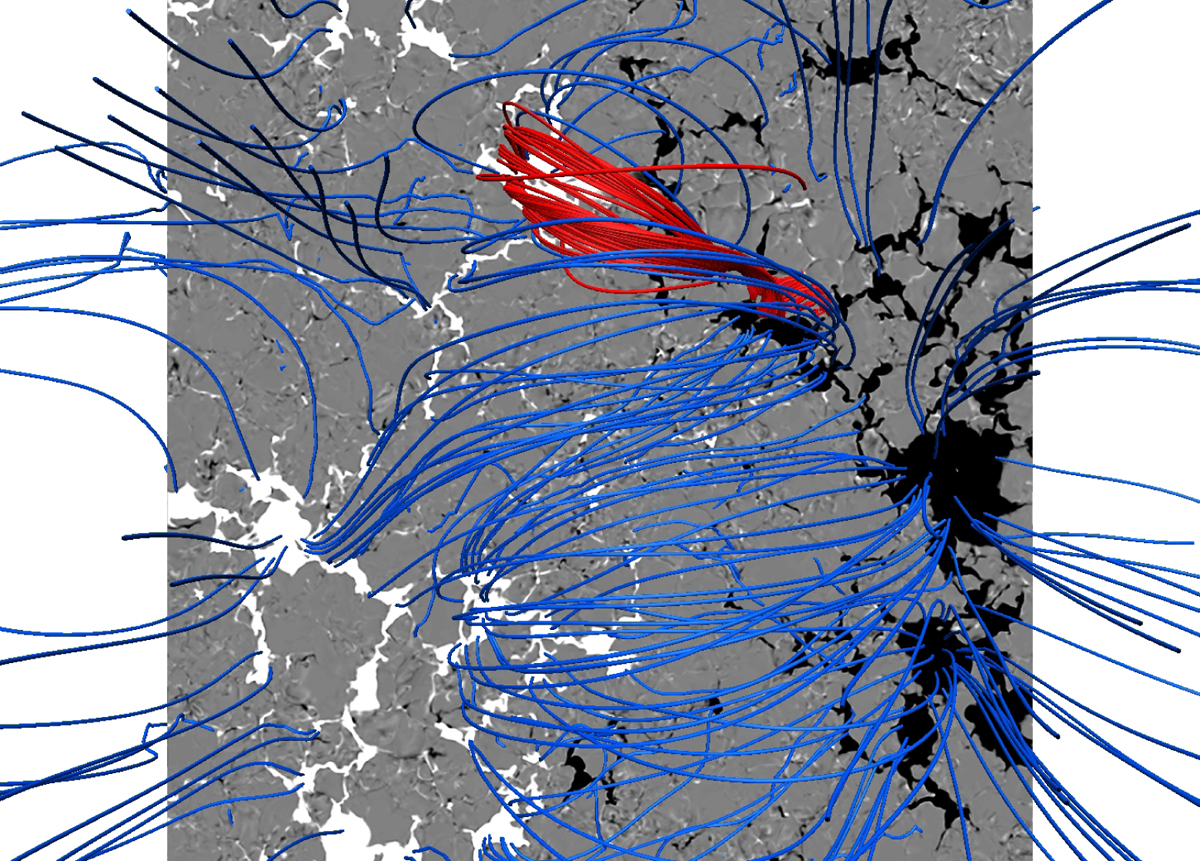
Overview of the full computational domain (40 × 40 × 22 Mm) and magnetic field configuration. The plane shows the vertical photospheric magnetic field in μ = 1 at t = 102 s. Red field lines show traced magnetic field lines in the region of the loop-like structure, sampled at high current density. Blue field lines show the magnetic field in the full FOV. This figure was produced using VAPOR (Li et al. 2019; www.vapor.ucar.edu).
Current usage metrics show cumulative count of Article Views (full-text article views including HTML views, PDF and ePub downloads, according to the available data) and Abstracts Views on Vision4Press platform.
Data correspond to usage on the plateform after 2015. The current usage metrics is available 48-96 hours after online publication and is updated daily on week days.
Initial download of the metrics may take a while.