Fig. 3.
Download original image
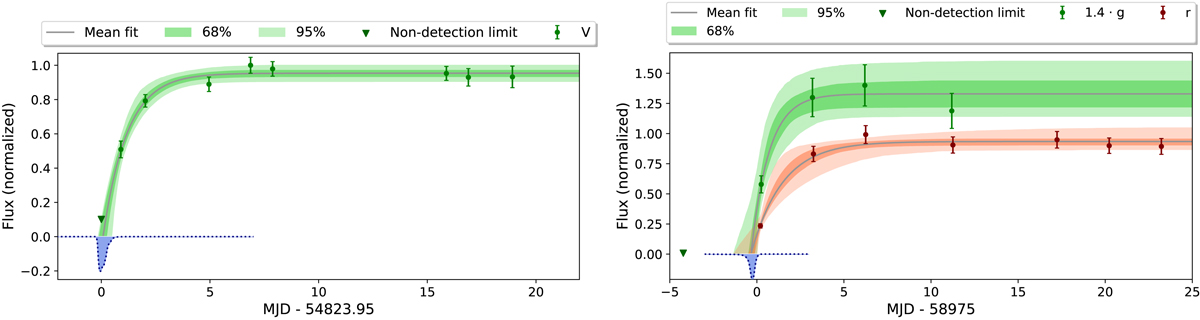
Exponential fit on the ROTSE light curve of SN 2008in (left) and the ZTF early light curves of SN 2020jfo (right). The blue shaded areas shows the obtained t0 posteriors. The black curves show the mean fit, namely, the fit that results by taking the mean of the posterior distributions. In case of SN 2020jfo, the g-band light curve was further rescaled after the normalization to improve clarity on the figure. The shaded regions denote the 68% and 95% confidence intervals.
Current usage metrics show cumulative count of Article Views (full-text article views including HTML views, PDF and ePub downloads, according to the available data) and Abstracts Views on Vision4Press platform.
Data correspond to usage on the plateform after 2015. The current usage metrics is available 48-96 hours after online publication and is updated daily on week days.
Initial download of the metrics may take a while.