Open Access
Fig. A.2.
Download original image
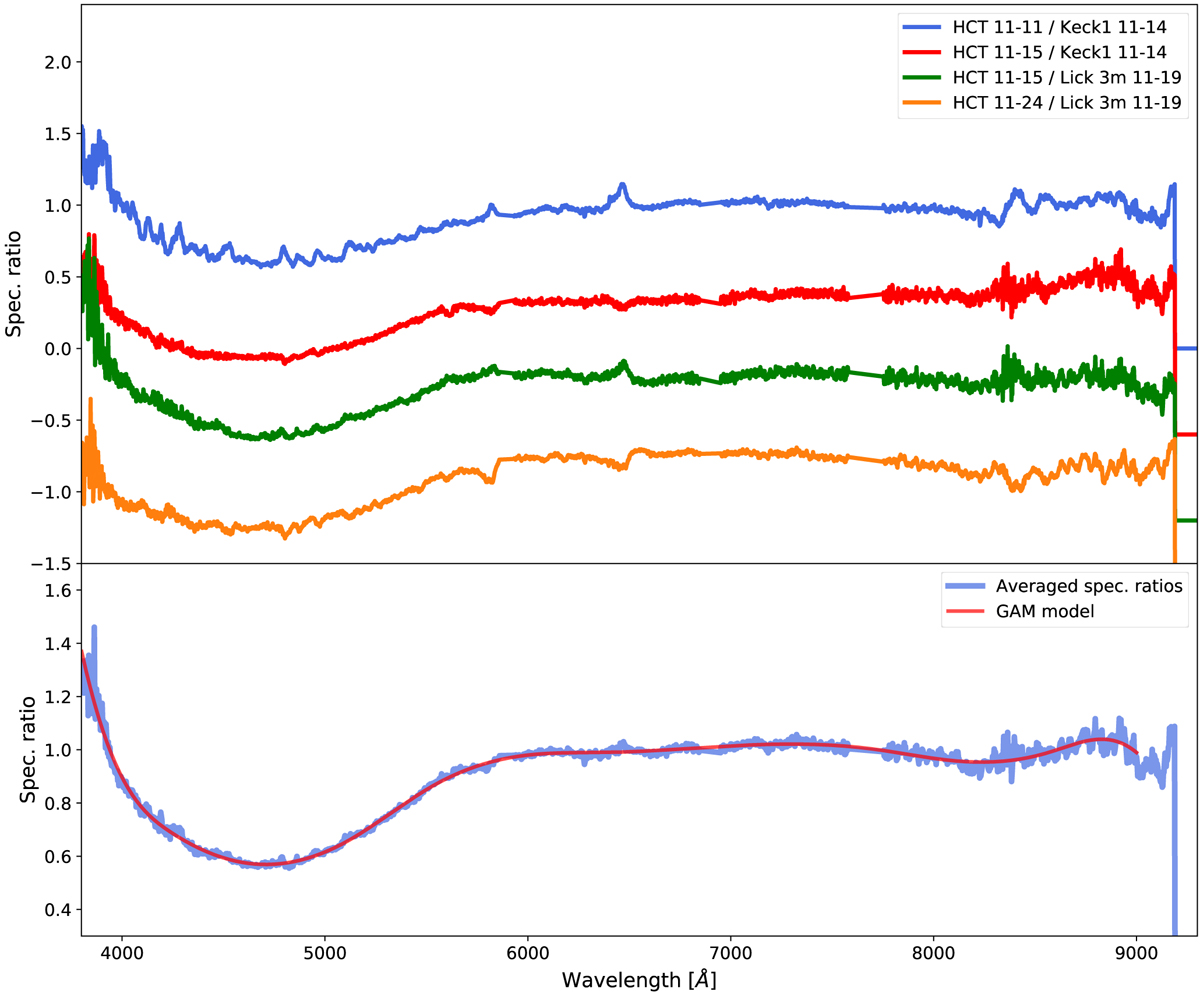
Differences between the HCT and Lick observatory spectra shown in A.1. Top panel: Ratios of selected HCT and Keck/Lick spectra that are close in time. Bottom panel: Average curve calculated from the four individual ones on the top panel, along with its GAM fit.
Current usage metrics show cumulative count of Article Views (full-text article views including HTML views, PDF and ePub downloads, according to the available data) and Abstracts Views on Vision4Press platform.
Data correspond to usage on the plateform after 2015. The current usage metrics is available 48-96 hours after online publication and is updated daily on week days.
Initial download of the metrics may take a while.