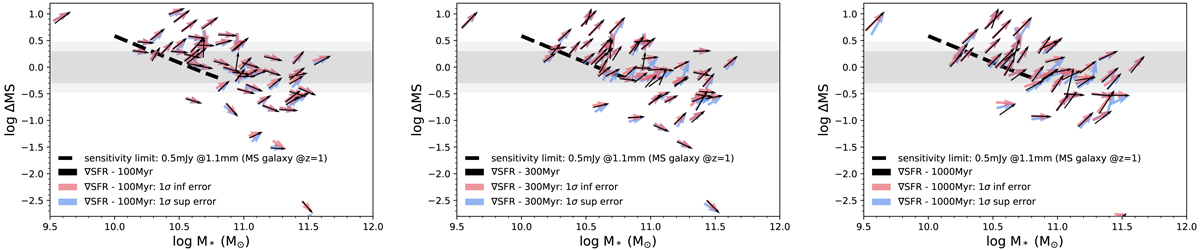
Fig. 8.
Download original image
GOODS-ALMA galaxies, including “SB in the MS”, placed on a ΔMS–M* plane. The assumed MS is from Schreiber et al. (2015). The orientation of the thin black arrows indicates the SFR gradient of each galaxy over a given time: 100 Myr (left panel), 300 Myr (middle panel), and 1 Gyr (right panel). The red and blue arrows represent the upper (blue) and lower (red) 1σ error on the gradient estimates.
Current usage metrics show cumulative count of Article Views (full-text article views including HTML views, PDF and ePub downloads, according to the available data) and Abstracts Views on Vision4Press platform.
Data correspond to usage on the plateform after 2015. The current usage metrics is available 48-96 hours after online publication and is updated daily on week days.
Initial download of the metrics may take a while.