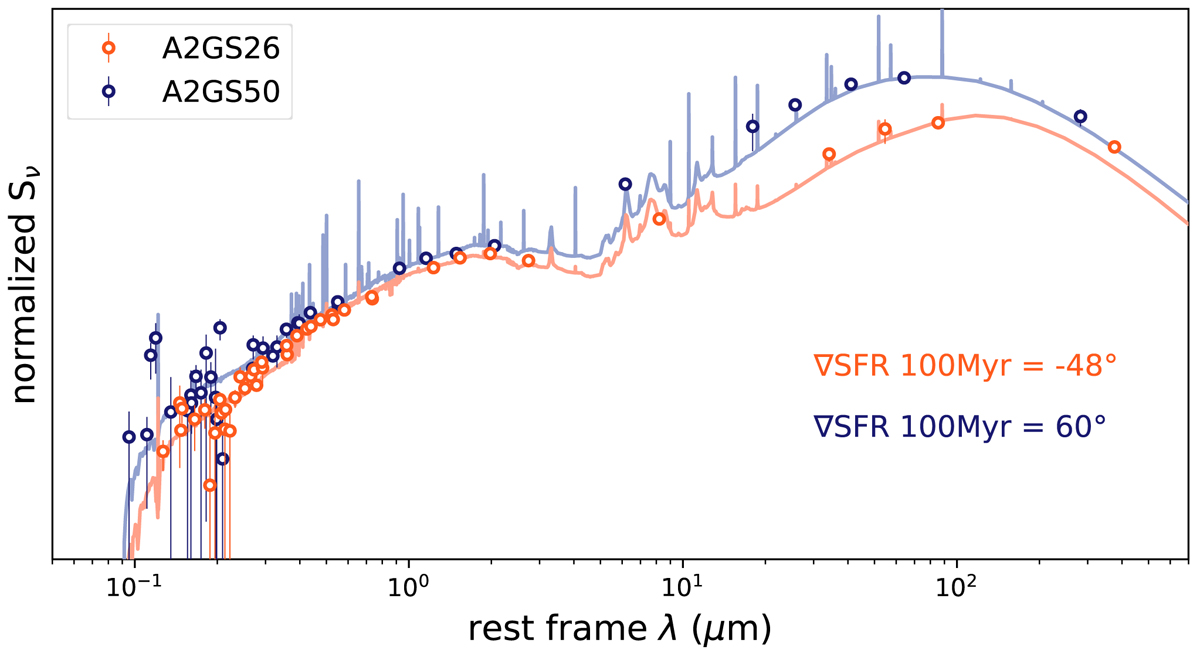
Fig. 7.
Download original image
Example of SED modelling results for two extreme gradient values: A2GS26 (orange) with a SFR gradient over 100 Myr of −48° and A2GS50 (blue) with a gradient of 60° over the same period. Circles are flux densities, while solid lines are the best fits. The SEDs are normalised to their rest-frame 2 μm flux densities, which is a proxy for stellar mass.
Current usage metrics show cumulative count of Article Views (full-text article views including HTML views, PDF and ePub downloads, according to the available data) and Abstracts Views on Vision4Press platform.
Data correspond to usage on the plateform after 2015. The current usage metrics is available 48-96 hours after online publication and is updated daily on week days.
Initial download of the metrics may take a while.