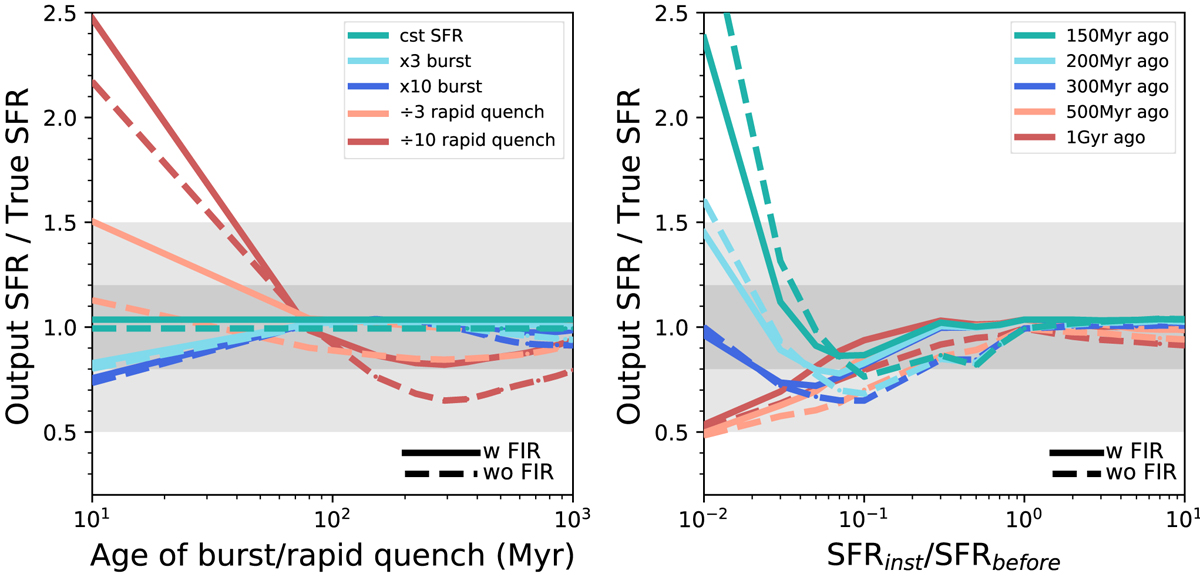
Fig. 2.
Download original image
Sensitivity of the non-parametric SFH in recovering rapid and recent variation of SFH. In both panels, the y-axis indicates the ratio between the estimated SFR obtained from the non-parametric SFH and the true one. The variation of this ratio is shown as a function of the age of the rapid variation (left panel) and its strength, which is the ratio between the instantaneous SFR and the SFR before the burst or quenching (right panel). In both panels, the solid line represents the results obtained when the full observed UV–mm SED is fitted and the dashed line shows results from when no FIR data are used for the fit.
Current usage metrics show cumulative count of Article Views (full-text article views including HTML views, PDF and ePub downloads, according to the available data) and Abstracts Views on Vision4Press platform.
Data correspond to usage on the plateform after 2015. The current usage metrics is available 48-96 hours after online publication and is updated daily on week days.
Initial download of the metrics may take a while.