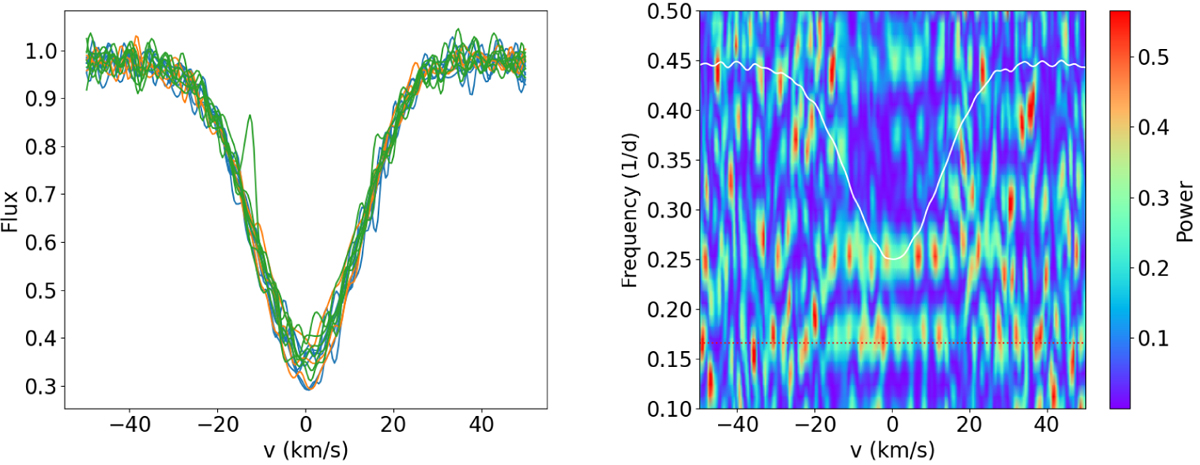
Fig. 7.
Download original image
LiI 6707 Å line profile. Left: the 34 line profile measurements from SOPHIE spectra are shown superimposed. The color code corresponds to successive rotational cycles. Right: 2D periodogram across the line profile. The dotted horizontal line drawn at a frequency of 0.166 day−1 indicates the stellar rotational period. The white curve displays the mean line profile. The color code reflects the periodogram power.
Current usage metrics show cumulative count of Article Views (full-text article views including HTML views, PDF and ePub downloads, according to the available data) and Abstracts Views on Vision4Press platform.
Data correspond to usage on the plateform after 2015. The current usage metrics is available 48-96 hours after online publication and is updated daily on week days.
Initial download of the metrics may take a while.