Open Access
Fig. 3.
Download original image
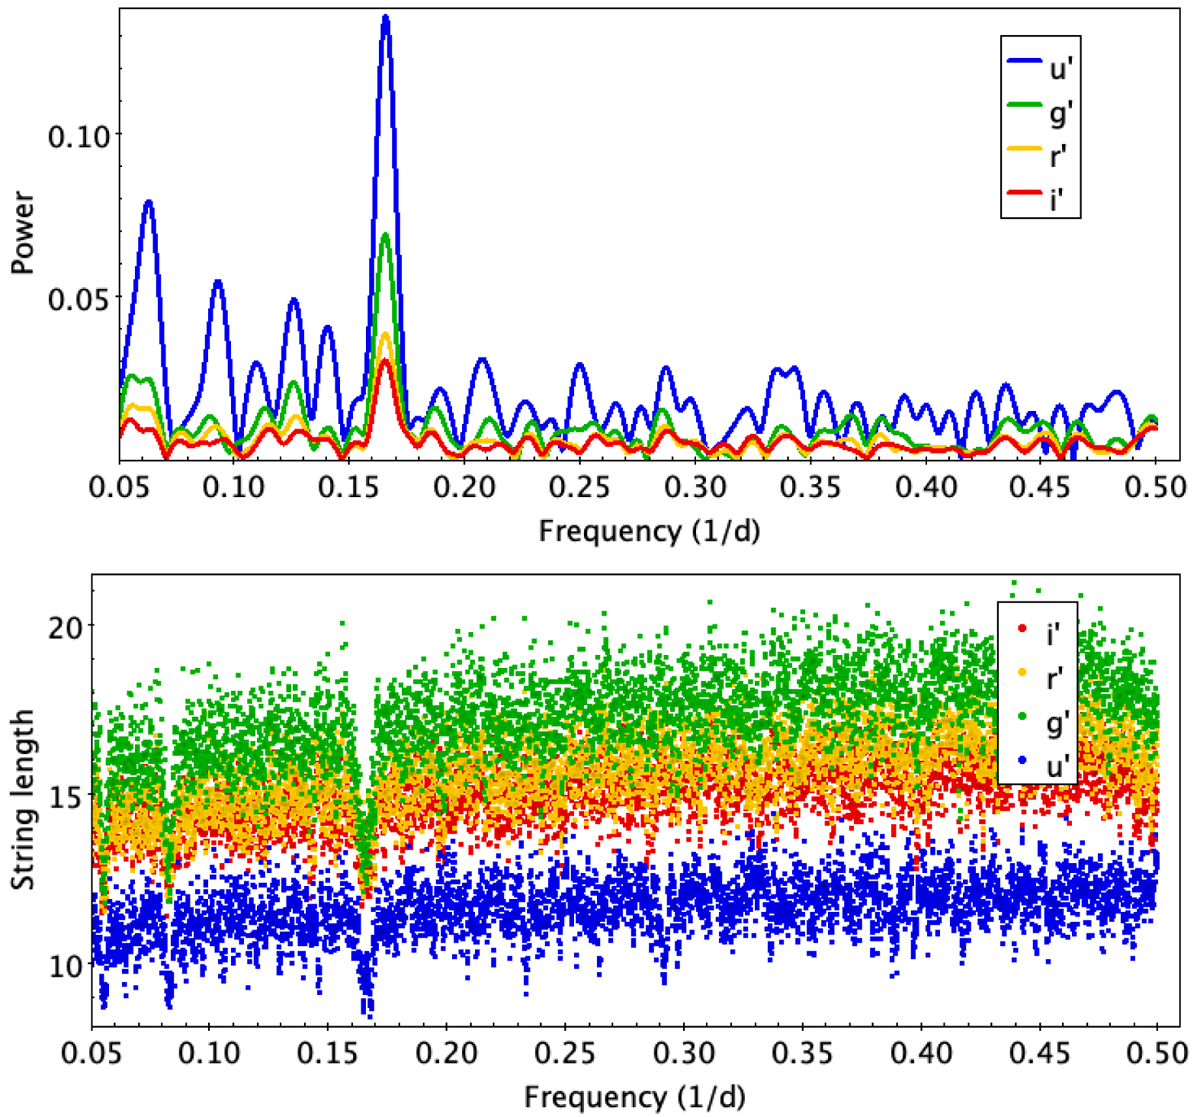
Period search results. Top: CLEAN periodogram analysis of the u′g′r′i′ light curves. A peak occurs at the frequency of 0.166 day−1, which corresponds to a period of 6.04 ± 0.15 days. Bottom: string-length analysis of the u′g′r′i′ light curves. A clear minimum appears for a period of 6.03 ± 0.15 days.
Current usage metrics show cumulative count of Article Views (full-text article views including HTML views, PDF and ePub downloads, according to the available data) and Abstracts Views on Vision4Press platform.
Data correspond to usage on the plateform after 2015. The current usage metrics is available 48-96 hours after online publication and is updated daily on week days.
Initial download of the metrics may take a while.