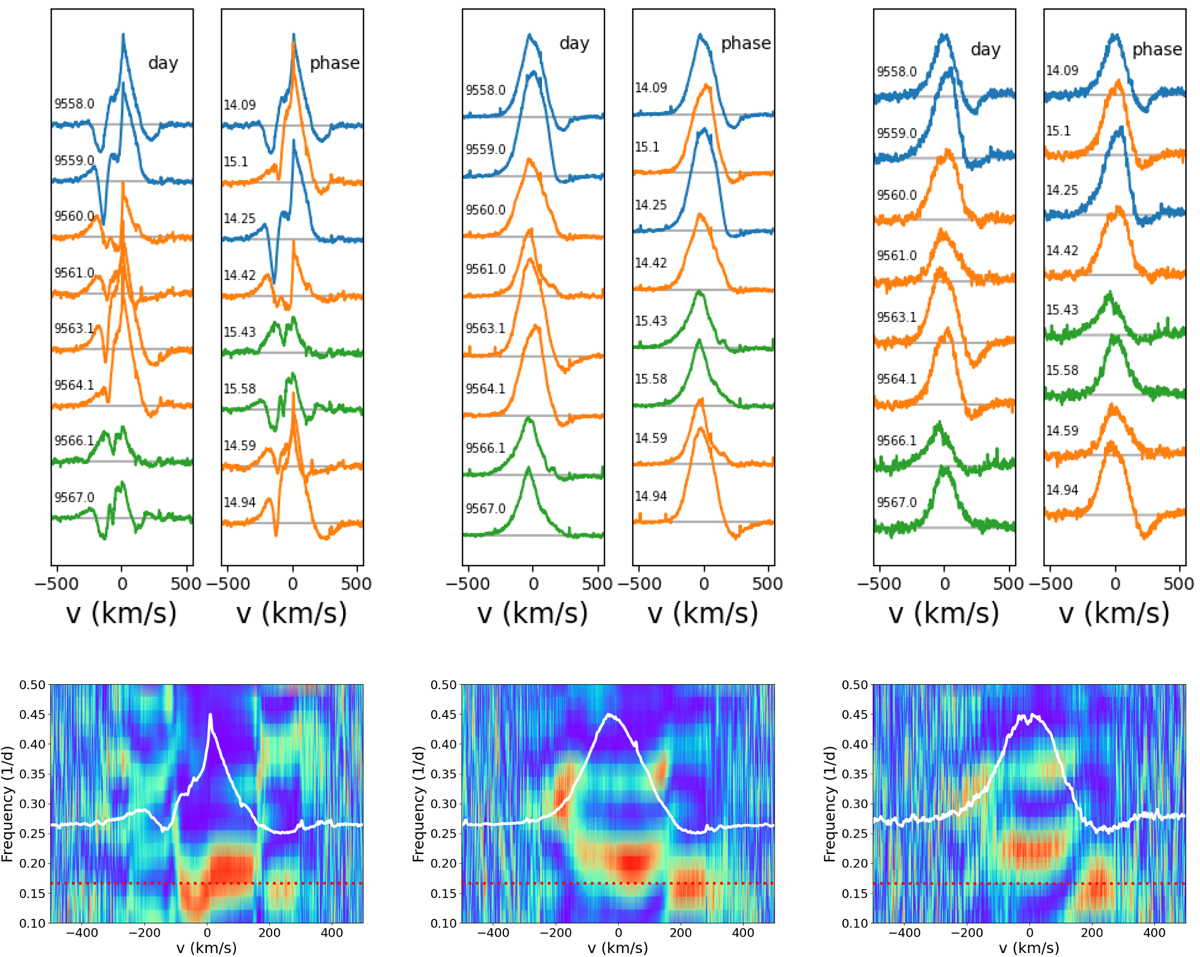
Fig. E.4.
Download original image
Near-infrared HeI (left), Paβ (center), and Brγ (right) line profiles obtained over nine days during the December 2021 SPIRou run. Top: Line profiles are plotted as a function of Julian date (left subpanels) and rotational phase (right subpanels). The colors represent successive rotational cycles. Bottom: 2D periodograms across the line profiles. The dotted horizontal red line drawn at a frequency of 0.166 day−1 indicates the stellar rotational period. The white curve displays the mean line profile. The color code reflects the periodogram power from zero (blue) to 1 (red).
Current usage metrics show cumulative count of Article Views (full-text article views including HTML views, PDF and ePub downloads, according to the available data) and Abstracts Views on Vision4Press platform.
Data correspond to usage on the plateform after 2015. The current usage metrics is available 48-96 hours after online publication and is updated daily on week days.
Initial download of the metrics may take a while.