Open Access
Fig. B.3.
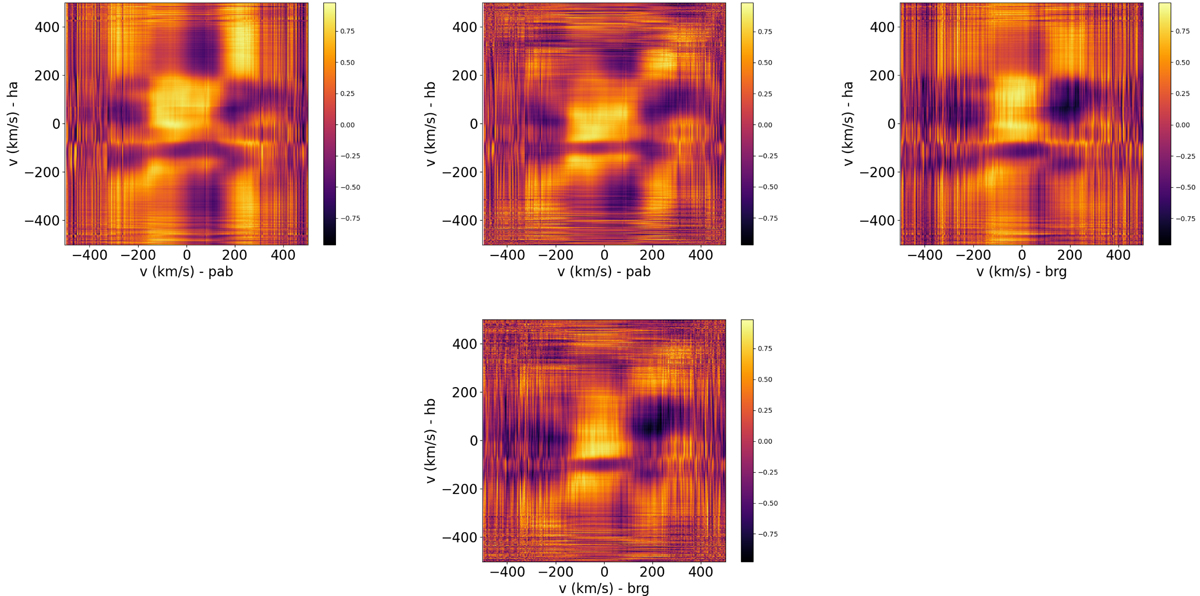
Download original image
Correlation matrices between optical and near-infrared hydrogen line profiles computed from ten OHP/SOPHIE and ten CFHT/SPIRou spectra obtained over the same nights during the October runs: Hα ⋆ Paβ (left), Hβ ⋆ Paβ (center left), Hα ⋆ Brγ (center right), and Hβ ⋆ Brγ (right).
Current usage metrics show cumulative count of Article Views (full-text article views including HTML views, PDF and ePub downloads, according to the available data) and Abstracts Views on Vision4Press platform.
Data correspond to usage on the plateform after 2015. The current usage metrics is available 48-96 hours after online publication and is updated daily on week days.
Initial download of the metrics may take a while.