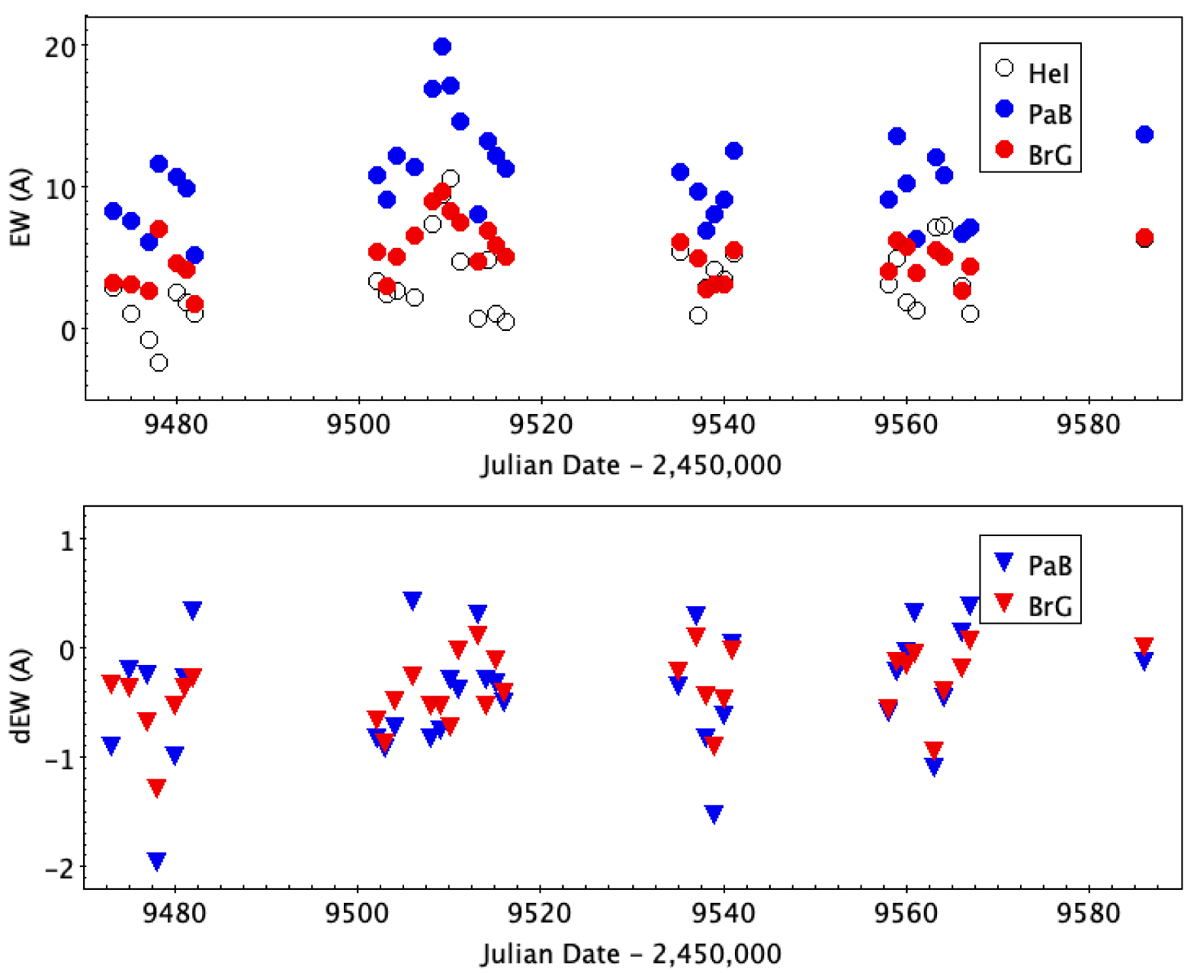
Fig. 12.
Download original image
EW of near-infrared lines. Top: EW of the HeI, Paβ, and Brγ lines measured on SPIRou spectra plotted as a function of Julian date. The measurement uncertainties are about the symbol size. Bottom: difference between the EWs measured by direct line profile integration (i.e., including the redshifted absorption component) and the EW derived from the Gaussian fitting of the emission component only plotted as a function of Julian date. This differential quantity measures the strength of the redshifted absorption component in the Paβ and Brγ line profiles. The more negative the differential quantity, the deeper the redshifted absorption.
Current usage metrics show cumulative count of Article Views (full-text article views including HTML views, PDF and ePub downloads, according to the available data) and Abstracts Views on Vision4Press platform.
Data correspond to usage on the plateform after 2015. The current usage metrics is available 48-96 hours after online publication and is updated daily on week days.
Initial download of the metrics may take a while.