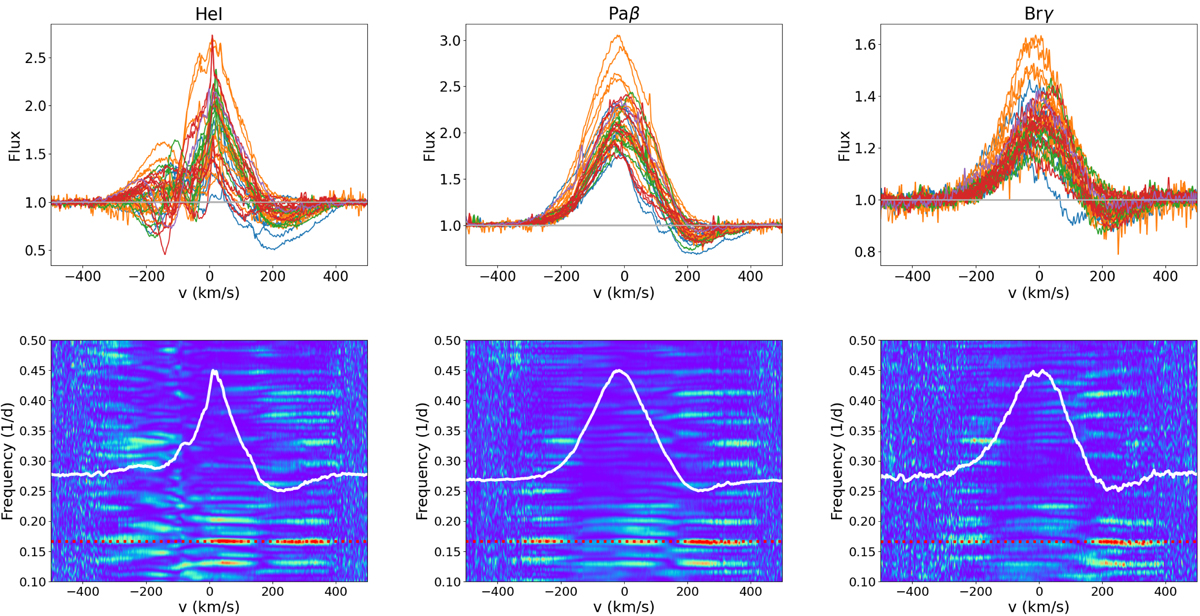
Fig. 11.
Download original image
Near-infrared line profile variability. Top: series of residual near-infrared line profiles HeI (left), Paβ (center), and Brγ (right), plotted superimposed to illustrate their variability. Each color represents a SPIRou run as in Fig. 10. Bottom: 2D periodograms across the line profiles. The color code reflects the periodogram power from zero (blue) to 0.5 (red). The dotted red horizontal line drawn at a frequency of 0.166 day−1 indicates the stellar rotational period. The white curve displays the mean line profile.
Current usage metrics show cumulative count of Article Views (full-text article views including HTML views, PDF and ePub downloads, according to the available data) and Abstracts Views on Vision4Press platform.
Data correspond to usage on the plateform after 2015. The current usage metrics is available 48-96 hours after online publication and is updated daily on week days.
Initial download of the metrics may take a while.