Fig. 1.
Download original image
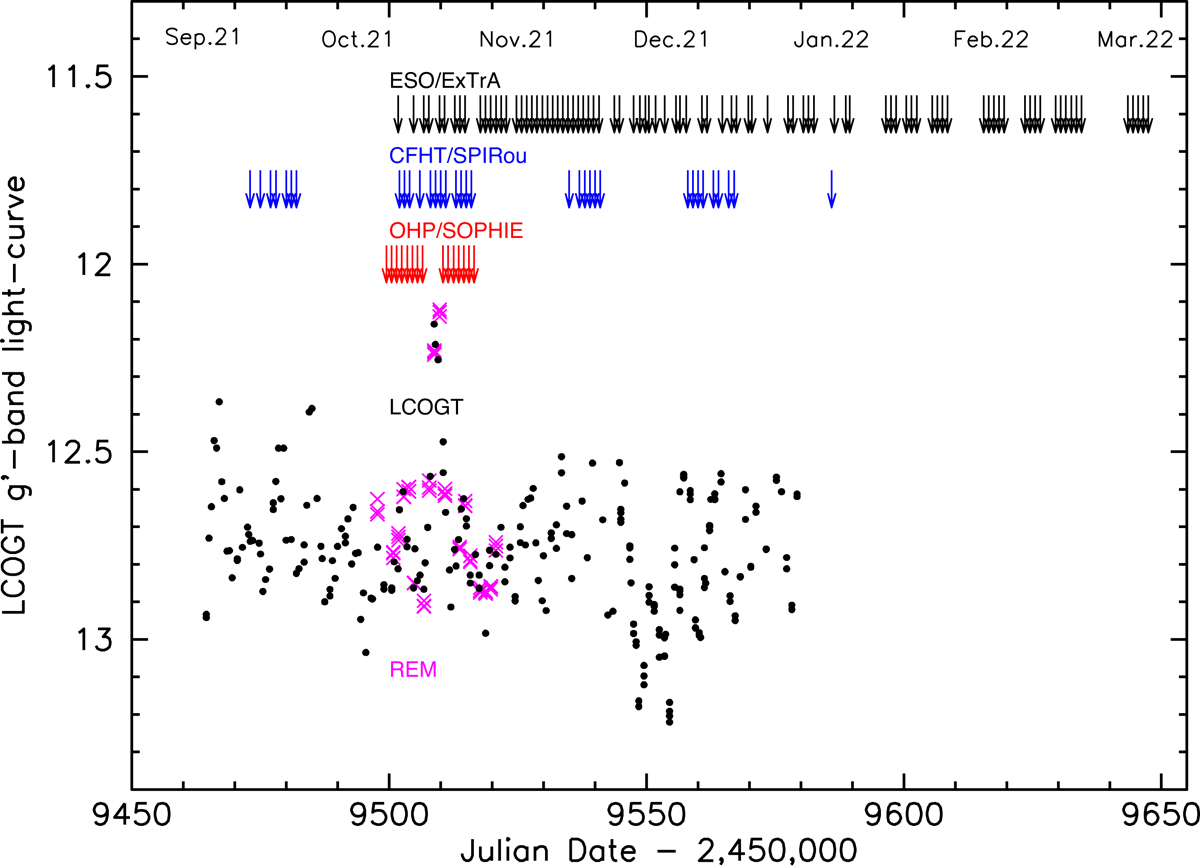
Temporal sampling of the GM Aur campaign from September 6, 2021, to March 8, 2022. Bottom: g′-band light curve from LCOGT (black dots) and from REM (magenta crosses). The REM g′-band magnitudes are offset in this figure by +0.1 mag to match the LCOGT measurements. The mean photometric error on both the LCOGT and REM g′-band measurements is 0.025 mag. Vertical arrows: the vertical arrows show the dates of OHP/SOPHIE (red), CFHT/SPIRou (blue), and ESO/ExTrA (black) observations. The core of the campaign took place during October 2021 with contemporaneous measurements from the five instruments.
Current usage metrics show cumulative count of Article Views (full-text article views including HTML views, PDF and ePub downloads, according to the available data) and Abstracts Views on Vision4Press platform.
Data correspond to usage on the plateform after 2015. The current usage metrics is available 48-96 hours after online publication and is updated daily on week days.
Initial download of the metrics may take a while.