Open Access
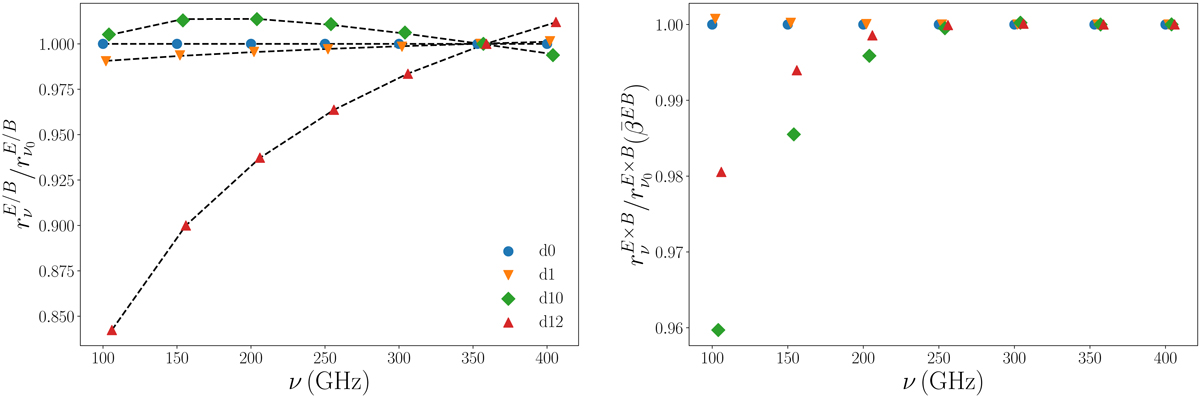
Fig. 6.
Download original image
Graph of ![]() and
and ![]() for different PYSM dust models. The shapes are defined as follows: d0 (blue circles), d1 (orange reversed triangles), d10 (green diamonds), and d12 (red triangles).
for different PYSM dust models. The shapes are defined as follows: d0 (blue circles), d1 (orange reversed triangles), d10 (green diamonds), and d12 (red triangles).
Current usage metrics show cumulative count of Article Views (full-text article views including HTML views, PDF and ePub downloads, according to the available data) and Abstracts Views on Vision4Press platform.
Data correspond to usage on the plateform after 2015. The current usage metrics is available 48-96 hours after online publication and is updated daily on week days.
Initial download of the metrics may take a while.