Open Access
Fig. 5.
Download original image
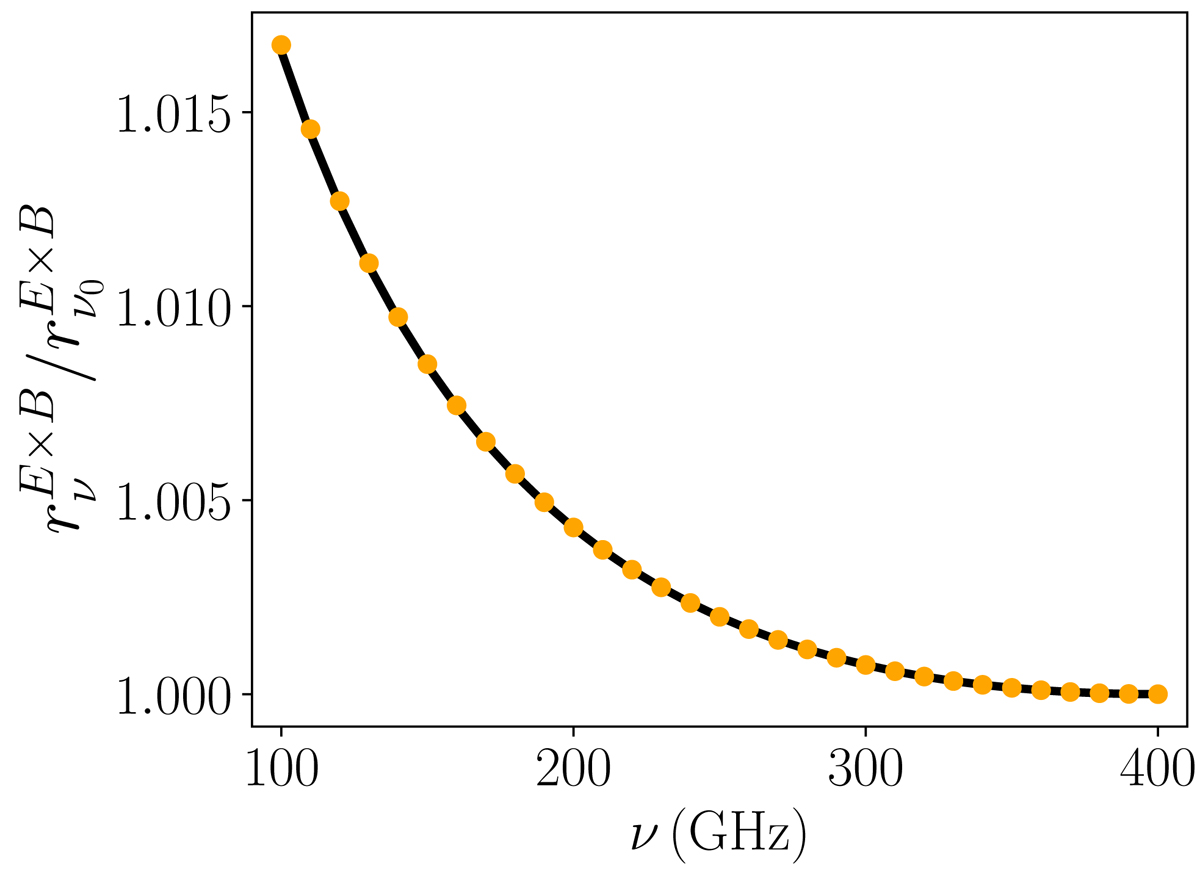
Graph of ![]() normalized at ν0 for the toy model filament. The black curve represents the analytical prediction from the spin-moment maps.
normalized at ν0 for the toy model filament. The black curve represents the analytical prediction from the spin-moment maps.
Current usage metrics show cumulative count of Article Views (full-text article views including HTML views, PDF and ePub downloads, according to the available data) and Abstracts Views on Vision4Press platform.
Data correspond to usage on the plateform after 2015. The current usage metrics is available 48-96 hours after online publication and is updated daily on week days.
Initial download of the metrics may take a while.