Fig. 4.
Download original image
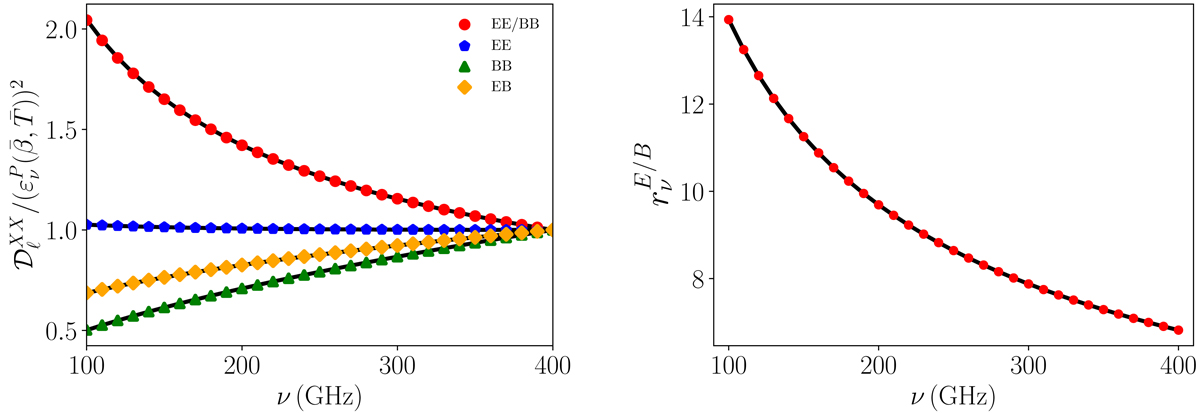
Spectral dependence of the toy model filament polarized power spectra. Left: polarized power spectra divided by the pivot-modified blackbody squared for the special case of ψbg = 30°. All spectra are normalized with respect to their value at ν0. The signals are shown in color: EE/BB (red), EE (blue), BB (green), and EB (orange). The black dashed lines were recovered by deriving the moment power spectra from the spin-moment maps. Right: close up view on ![]() . The black curve represents the best-fit of Eq. (30).
. The black curve represents the best-fit of Eq. (30).
Current usage metrics show cumulative count of Article Views (full-text article views including HTML views, PDF and ePub downloads, according to the available data) and Abstracts Views on Vision4Press platform.
Data correspond to usage on the plateform after 2015. The current usage metrics is available 48-96 hours after online publication and is updated daily on week days.
Initial download of the metrics may take a while.