Fig. B.1.
Download original image
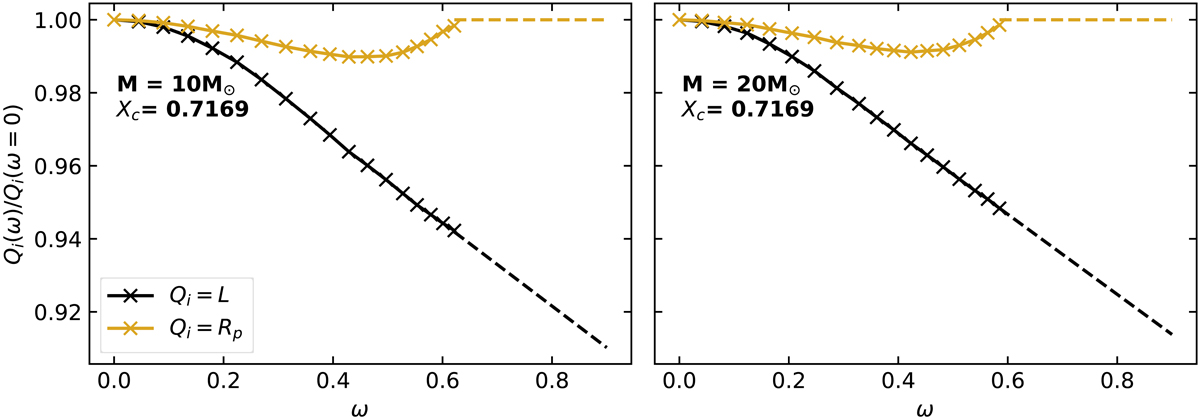
Variation of luminosity (black line), L, and polar radius (yellow line), Rp, normalised to the values of a non-rotating star as a function of critical velocity fraction, ω. The left panel shows models with masses 10M⊙ and the right panel 20M⊙. All models have burnt 3% by mass of their initial hydrogen (i.e. Xc = 0.7169). Each cross represents a value computed by a MESA model. Dashed lines show extrapolated values.
Current usage metrics show cumulative count of Article Views (full-text article views including HTML views, PDF and ePub downloads, according to the available data) and Abstracts Views on Vision4Press platform.
Data correspond to usage on the plateform after 2015. The current usage metrics is available 48-96 hours after online publication and is updated daily on week days.
Initial download of the metrics may take a while.