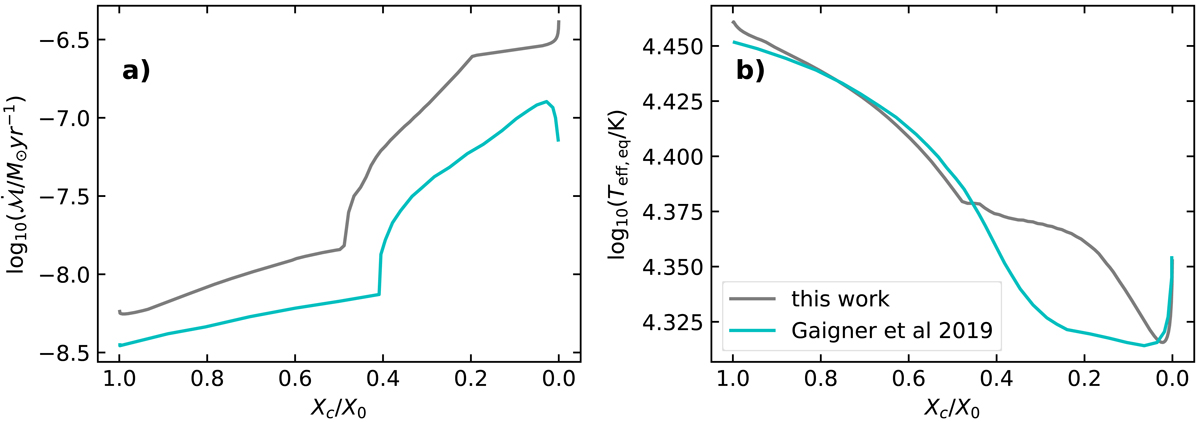
Fig. 4.
Download original image
Comparison of the global mass-loss rates (left panel) and equatorial effective temperatures (right panel) predicted by this work and that of Gagnier et al. (2019a). Shown are the results of 15 M⊙ models with solar metallicity and initial critical velocity fraction, ω = 0.5. Predictions of this work are plotted as grey lines, and those of Gagnier et al. (2019a) as cyan lines. The x-axis depicts the central hydrogen mass fraction normalised to the initial value. The panels in this figure are directly comparable to Figs. 13 and 14 of Gagnier et al. (2019a).
Current usage metrics show cumulative count of Article Views (full-text article views including HTML views, PDF and ePub downloads, according to the available data) and Abstracts Views on Vision4Press platform.
Data correspond to usage on the plateform after 2015. The current usage metrics is available 48-96 hours after online publication and is updated daily on week days.
Initial download of the metrics may take a while.