Fig. 2.
Download original image
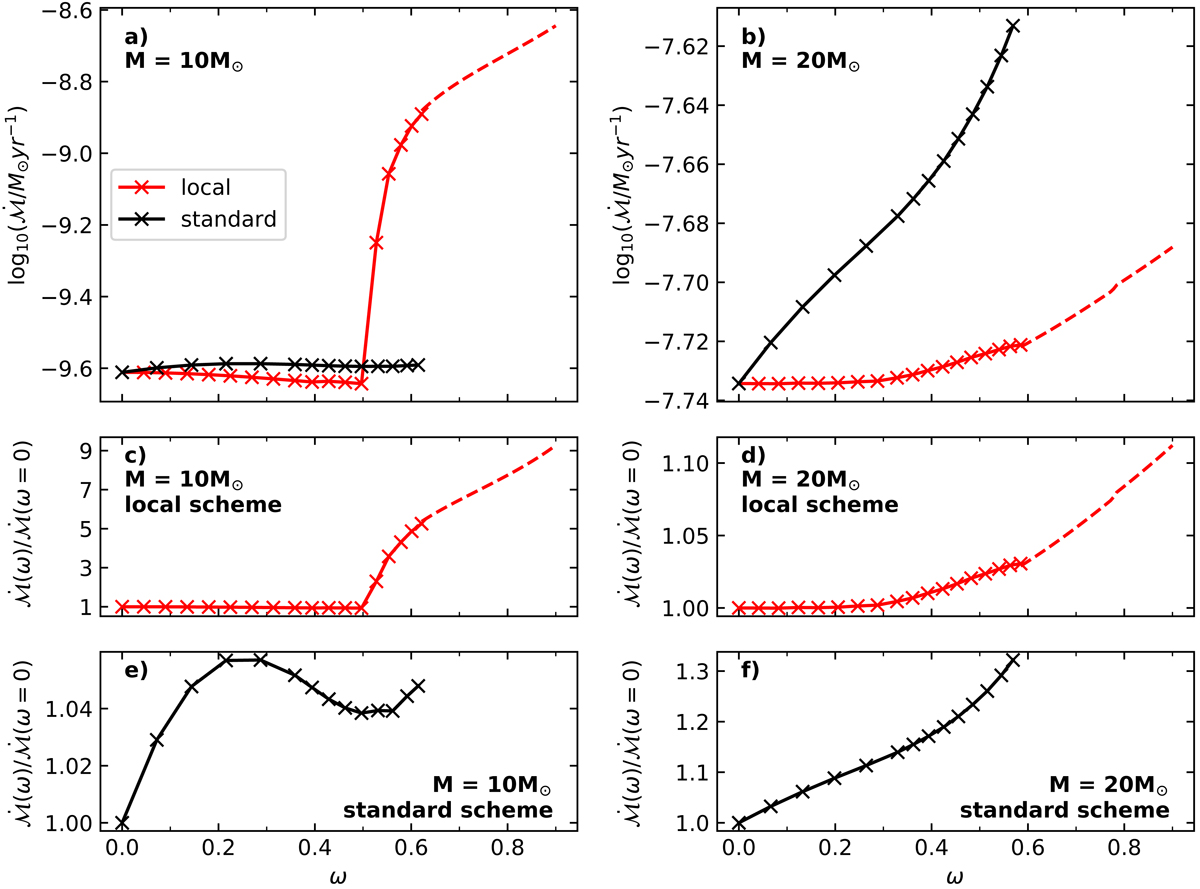
Upper panels: global mass-loss rates as a function of critical velocity fraction, ω, for 10 M⊙ (left panel) and 20 M⊙ models (right panel). Predictions of the local scheme, where surface mass flux is determined by Eq. (16) and the global mass-loss rate given by Eq. (11), are given in red. The standard scheme, where the mass loss rates are increased by Eq. (17) is depicted in black. All models have burnt 3% by mass of their initial hydrogen (i.e., Xc = 0.7169). Dotted lines represent mass-loss rates calculated from extrapolation (see Sect. 2.3). Lower panels: ratios of rotating star mass-loss to non-rotating star mass loss, ![]() , for each combination of mass-loss model and initial mass as given in each panel.
, for each combination of mass-loss model and initial mass as given in each panel.
Current usage metrics show cumulative count of Article Views (full-text article views including HTML views, PDF and ePub downloads, according to the available data) and Abstracts Views on Vision4Press platform.
Data correspond to usage on the plateform after 2015. The current usage metrics is available 48-96 hours after online publication and is updated daily on week days.
Initial download of the metrics may take a while.