Fig. 4.
Download original image
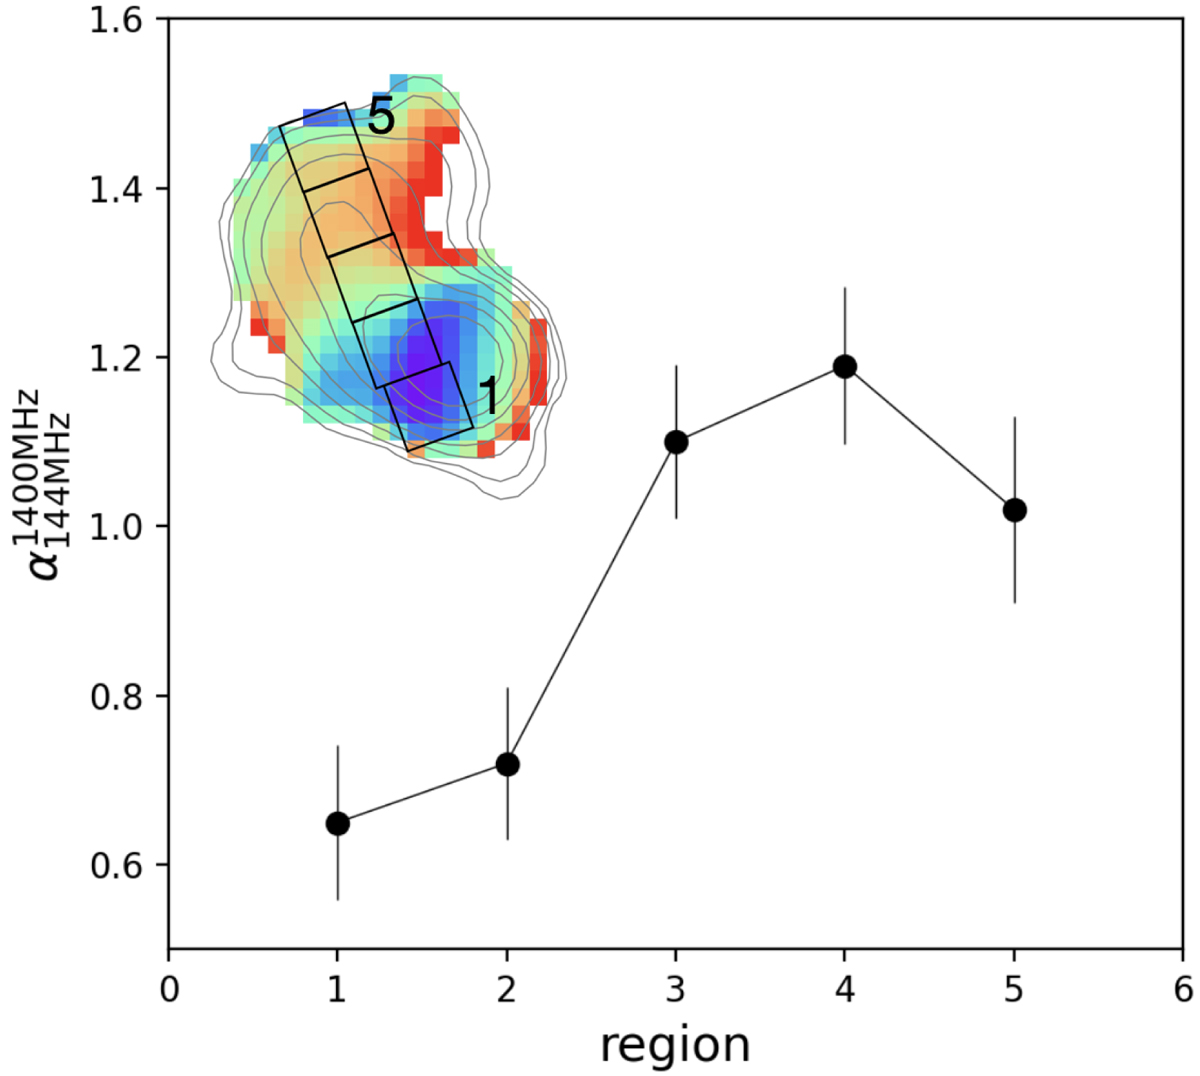
Spectral index profile in the frequency range 144–1400 MHz across the western lobe of J103025+052430. The regions we used to extract the spectral profile are shown as black boxes overlaid on the lobe in the top left corner and have sizes equal to the beam dimension (6 arcsec = 50 kpc). In the outermost region of the backflow, the spectral index shows a tentative flattening, as discussed in Sect. 4.2.
Current usage metrics show cumulative count of Article Views (full-text article views including HTML views, PDF and ePub downloads, according to the available data) and Abstracts Views on Vision4Press platform.
Data correspond to usage on the plateform after 2015. The current usage metrics is available 48-96 hours after online publication and is updated daily on week days.
Initial download of the metrics may take a while.