Fig. 3.
Download original image
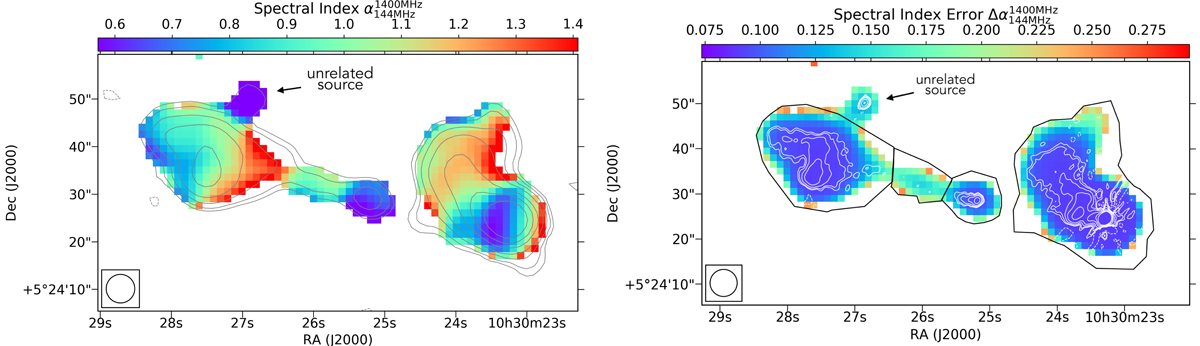
Radio spectral index map of J103025+052430 in the range 144–1400 MHz with 6 arcsec resolution (left panel) and respective spectral index uncertainty map (right panel). The spectral index values across the radio galaxy vary in the range [0.46–1.78], but the colour scale has been compressed for visualisation purposes. Only pixels above 3σ in both images are used. The beam size is shown in the bottom left corner. Contours in the left panel represent the 144-MHz emission as shown in Fig. 2 (left panel). White contours in the right panel represent the JVLA 1400-MHz emission at 1 arcsec resolution presented in D’Amato et al. (2022). with levels equal to [−3, 3,5, 10, 20, 50, 100, 200]×σ, with σ = 0.004 mJy beam−1. Black regions in the right panel represent the regions we used to measure the flux densities listed in Table 2. The spectral index distribution of the source is overall consistent with what is typically observed in FRII radio galaxies. The compact source at RA = 10h30′27″ Dec = 5d24m50s is an unrelated source.
Current usage metrics show cumulative count of Article Views (full-text article views including HTML views, PDF and ePub downloads, according to the available data) and Abstracts Views on Vision4Press platform.
Data correspond to usage on the plateform after 2015. The current usage metrics is available 48-96 hours after online publication and is updated daily on week days.
Initial download of the metrics may take a while.