Fig. 8
Download original image
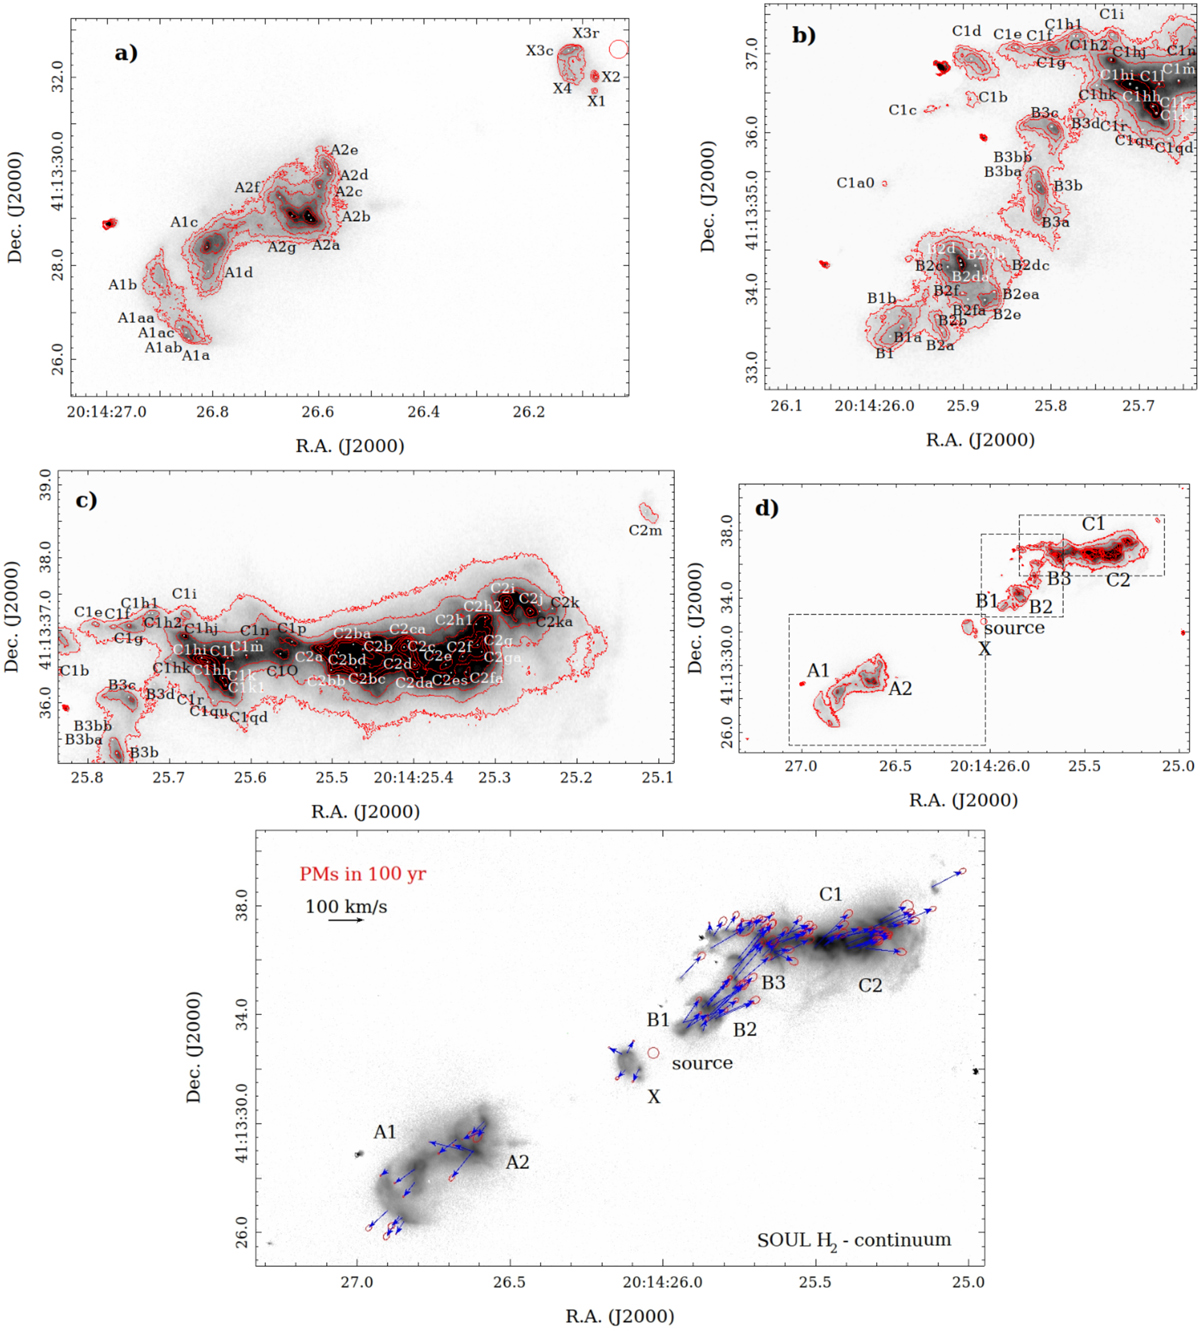
Knot identification in the SOUL H2 continuum-subtracted image of the IRAS 20126-4104 flow and knot proper motions. Panel a: zoom-in on the A and X knot regions (red-shifted lobe). Contour levels at 5, 7, 10, 15, 20, and 25σ are overlaid. We note that 1σ corresponds to 8×10⁻²³ W cm−2 arcsec−2. Panel b: zoom-in on the B and C1 knot regions (blue-shifted lobe). Contour levels at 5, 7, 10, 15, 30, and 40σ are overlaid. Panel c: zoom-in on the C1 and C2 knot regions (blue-shifted lobe). Contour levels at 5, 10, 20, 30, 40, 50, 60, 80, and 120σ are overlaid. Knot peaks are indicated by white dots. Panel d: overall view of the IRAS 20126+4104 flow close to the source. The main structures as reported in Caratti o Garatti et al. (2008) are labelled. Panel e: proper motions (PMs) with their uncertainties (blue arrows and red ellipses) in 100 yr of structures and sub-structures along the H2 jet in IRAS20126+4104. The actual observed shifts are approximately one fourth the length of the corresponding arrow. The red circle marks the position (along with its uncertainty) of the protostellar continuum emission at 1.4 mm (Cesaroni et al. 2014). The main structures as labelled in Caratti o Garatti et al. (2008) are also indicated.
Current usage metrics show cumulative count of Article Views (full-text article views including HTML views, PDF and ePub downloads, according to the available data) and Abstracts Views on Vision4Press platform.
Data correspond to usage on the plateform after 2015. The current usage metrics is available 48-96 hours after online publication and is updated daily on week days.
Initial download of the metrics may take a while.