Fig. 5
Download original image
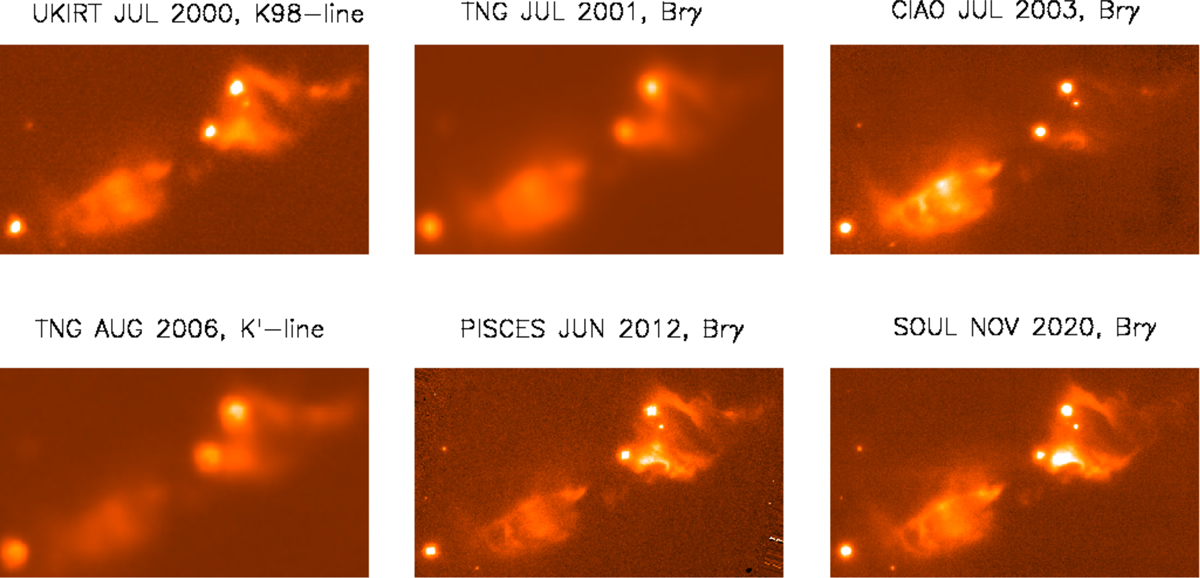
Comparison of the continuum emission throughout the various observed epochs. This has been approximated with the Brγ-filter images, except for the runs of July 2000 and August 2006 where broad-band K images corrected for line emission have been used. The flux levels have been adjusted so that the mean of the counts of stars 2 and 4 is the same in all frames. The dimming of the northern lobe (especially region N1) and the simultaneous brightening of the southern lobe in July 2003 are evident.
Current usage metrics show cumulative count of Article Views (full-text article views including HTML views, PDF and ePub downloads, according to the available data) and Abstracts Views on Vision4Press platform.
Data correspond to usage on the plateform after 2015. The current usage metrics is available 48-96 hours after online publication and is updated daily on week days.
Initial download of the metrics may take a while.