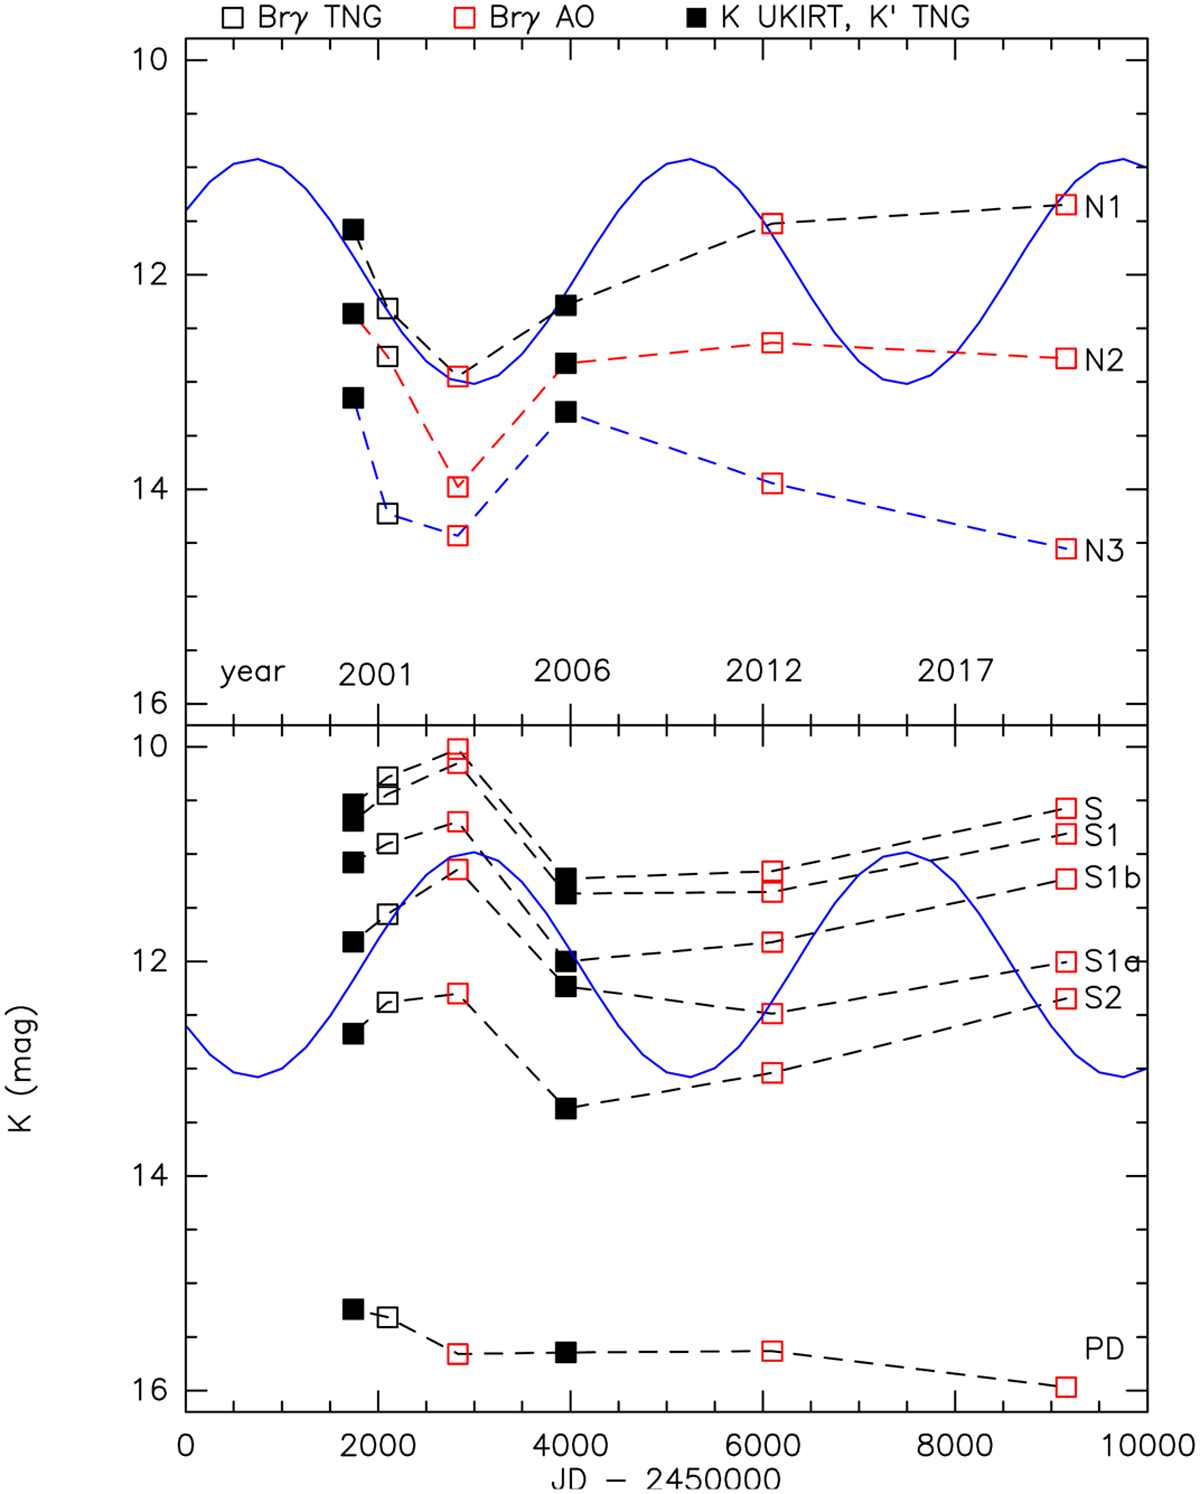
Fig. 4
Download original image
Photometric variability of the continuum features defined in Fig. 2. We note that N and S indicate the northern and southern lobe, respectively, and PD is the ring-like feature. The numbers increase from south-east to north-west. We note that S is further subdivided into S1 and S2, and S1 is in turn subdivided into S1a and S1b. The symbol size is ~0.2 mag in the vertical direction, which is comparable with the photometric errors. A sinusoid of period ~12 yr is overlaid on the N1 light curve. The same, but with a phase shift of π, is also drawn in the bottom box.
Current usage metrics show cumulative count of Article Views (full-text article views including HTML views, PDF and ePub downloads, according to the available data) and Abstracts Views on Vision4Press platform.
Data correspond to usage on the plateform after 2015. The current usage metrics is available 48-96 hours after online publication and is updated daily on week days.
Initial download of the metrics may take a while.