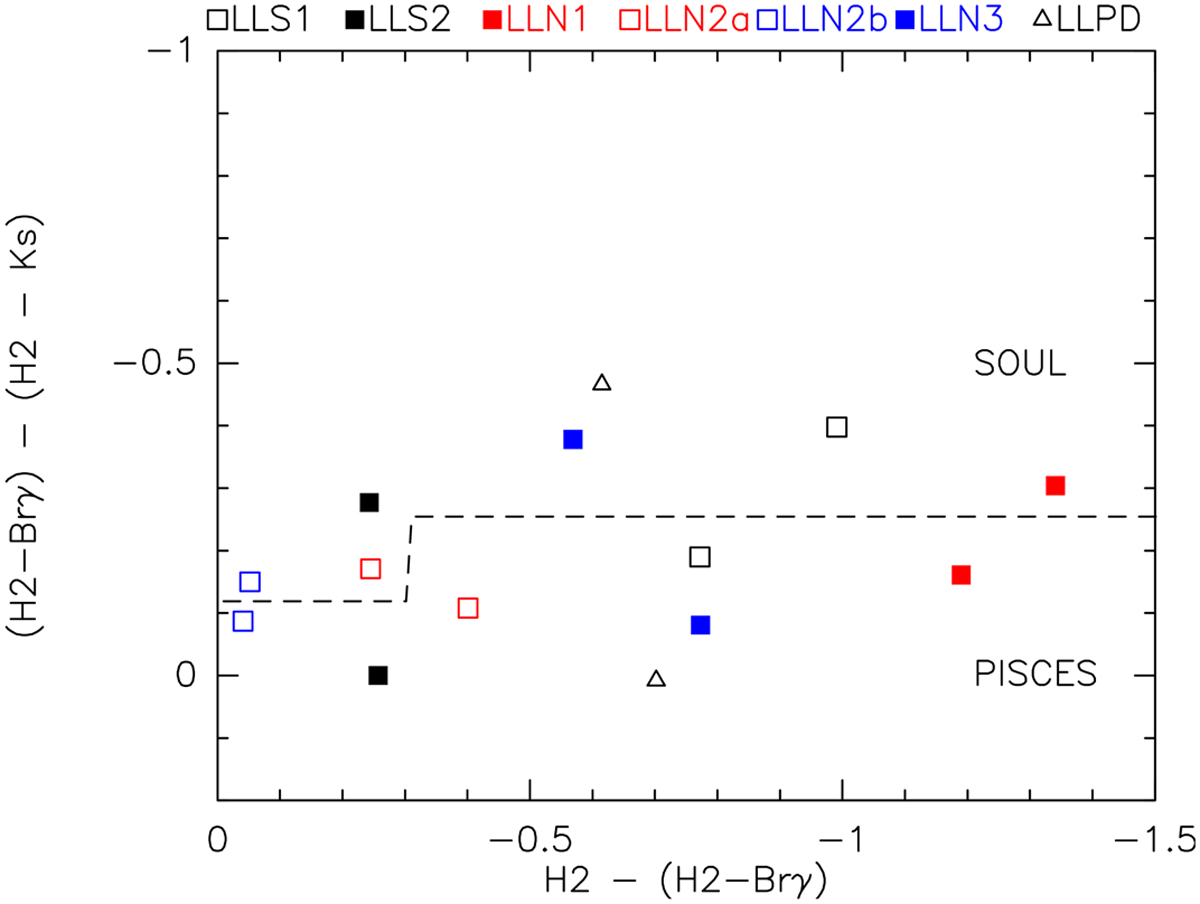
Fig. G.1
Download original image
Difference (in magnitudes) between the pure line flux in the polygons after continuum correction from the Brγ image, (H2 - Brγ) and the Ks image, (H2 - Ks) vs the continuum contamination (in magnitudes) in the polygons estimated as the difference between the total flux measured in the H2 band and the line flux corrected using the Brγ image (H2 - Brγ). The symbols refer to the polygons in Fig. 2, as explained at the top of the box. Two datasets have been used (PISCES 2012 and SOUL 2020).
Current usage metrics show cumulative count of Article Views (full-text article views including HTML views, PDF and ePub downloads, according to the available data) and Abstracts Views on Vision4Press platform.
Data correspond to usage on the plateform after 2015. The current usage metrics is available 48-96 hours after online publication and is updated daily on week days.
Initial download of the metrics may take a while.