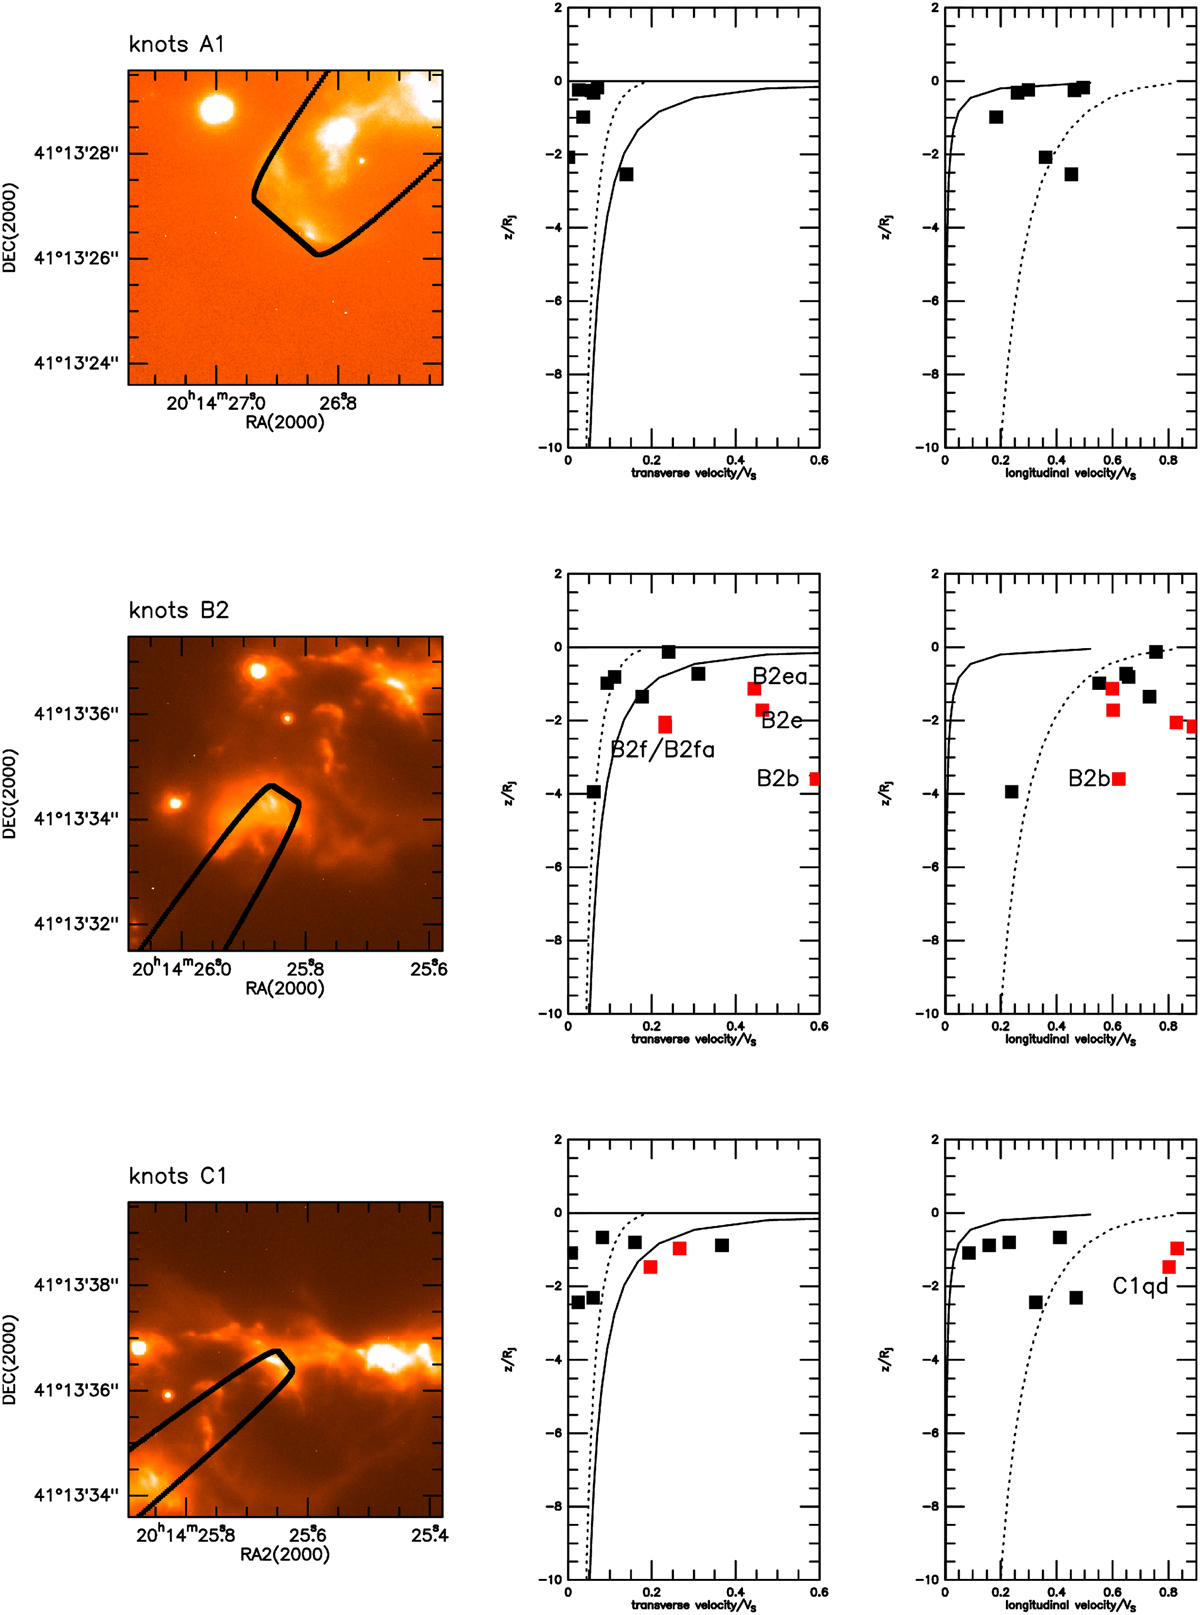
Fig. 14
Download original image
Ballistic bow-shock model of Ostriker et al. (2001) compared with knot chains A1 (top row), B2 (middle row), and C1 (bottom row). In the column on the left 6″ × 6″ zoom-ins of the SOUL H2 image are shown with the bow-shock model shape overlaid. In the middle column, the transverse velocities of the involved knots are compared with the mean shell (dotted line) and outer surface layer (solid line) values predicted by the model. The same comparison is made in the column on the right for the longitudinal velocities. The knots whose speed departs from the model predictions the most are marked in red and labelled. For the sake of simplicity, the outflow is assumed to lie on the plane of the sky.
Current usage metrics show cumulative count of Article Views (full-text article views including HTML views, PDF and ePub downloads, according to the available data) and Abstracts Views on Vision4Press platform.
Data correspond to usage on the plateform after 2015. The current usage metrics is available 48-96 hours after online publication and is updated daily on week days.
Initial download of the metrics may take a while.