Fig. 10
Download original image
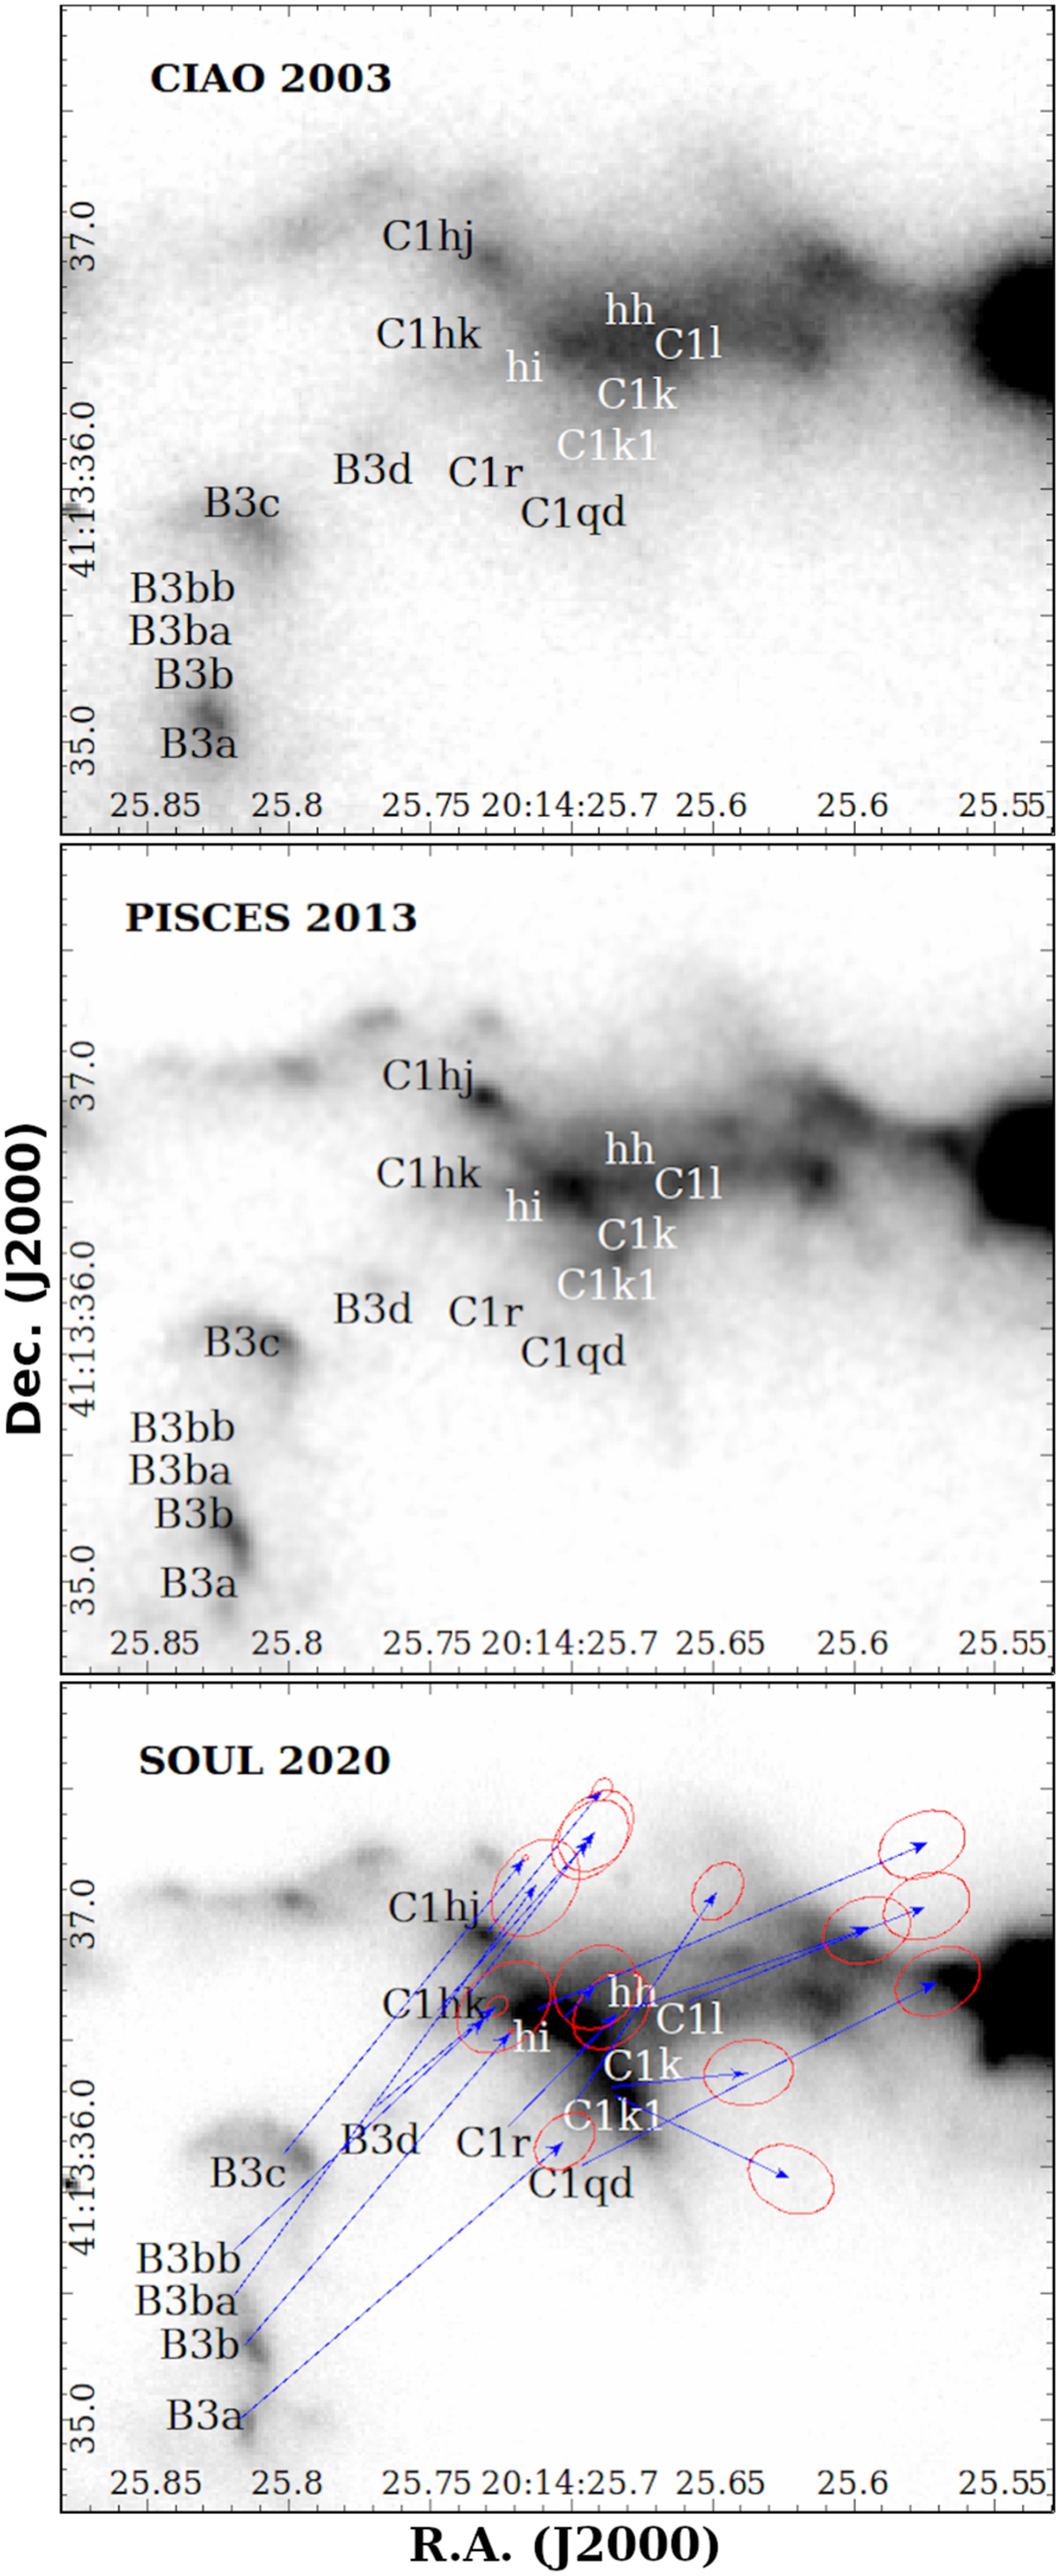
Evolution of the bright bow shock in the C1h and C1k regions. The top, middle and bottom panels show the same area of the sky at the three different epochs (2003, 2012, and 2020). The fast moving flow (υtg ~ 100–120 km s−1) corresponding to B3 shocks against the C1h and C1k regions (υtg ~ 10–70 km s−1) producing a bright bow shock. The PMs of knots are shown as in Fig. 8.
Current usage metrics show cumulative count of Article Views (full-text article views including HTML views, PDF and ePub downloads, according to the available data) and Abstracts Views on Vision4Press platform.
Data correspond to usage on the plateform after 2015. The current usage metrics is available 48-96 hours after online publication and is updated daily on week days.
Initial download of the metrics may take a while.