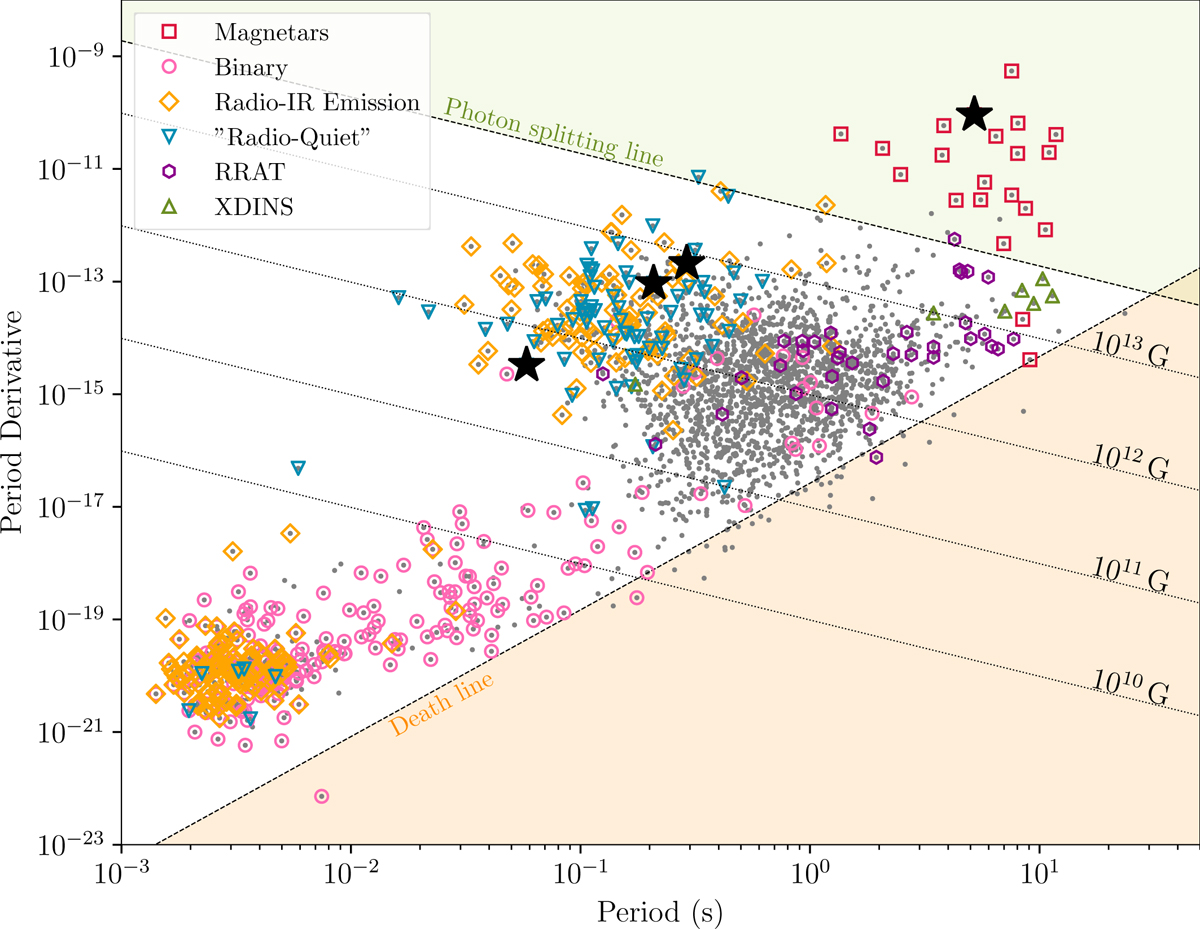
Fig. 2.
Download original image
P − Ṗ diagram showing the location of the sources presented in this work. All pulsars from the ATNF Pulsar Catalogue (Manchester et al. 2005) are shown as gray dots. Different pulsar classifications are encircled by different symbols. The sources discussed in this work are shown as black stars, from left to right: J1412+7922, J1932+1916, J1932+1916, and J1907+0919. The orange shaded region is delimited by the death line, while the green shaded region is delimited by the photon splitting line. Plot generated with psrqpy (Pitkin 2018).
Current usage metrics show cumulative count of Article Views (full-text article views including HTML views, PDF and ePub downloads, according to the available data) and Abstracts Views on Vision4Press platform.
Data correspond to usage on the plateform after 2015. The current usage metrics is available 48-96 hours after online publication and is updated daily on week days.
Initial download of the metrics may take a while.