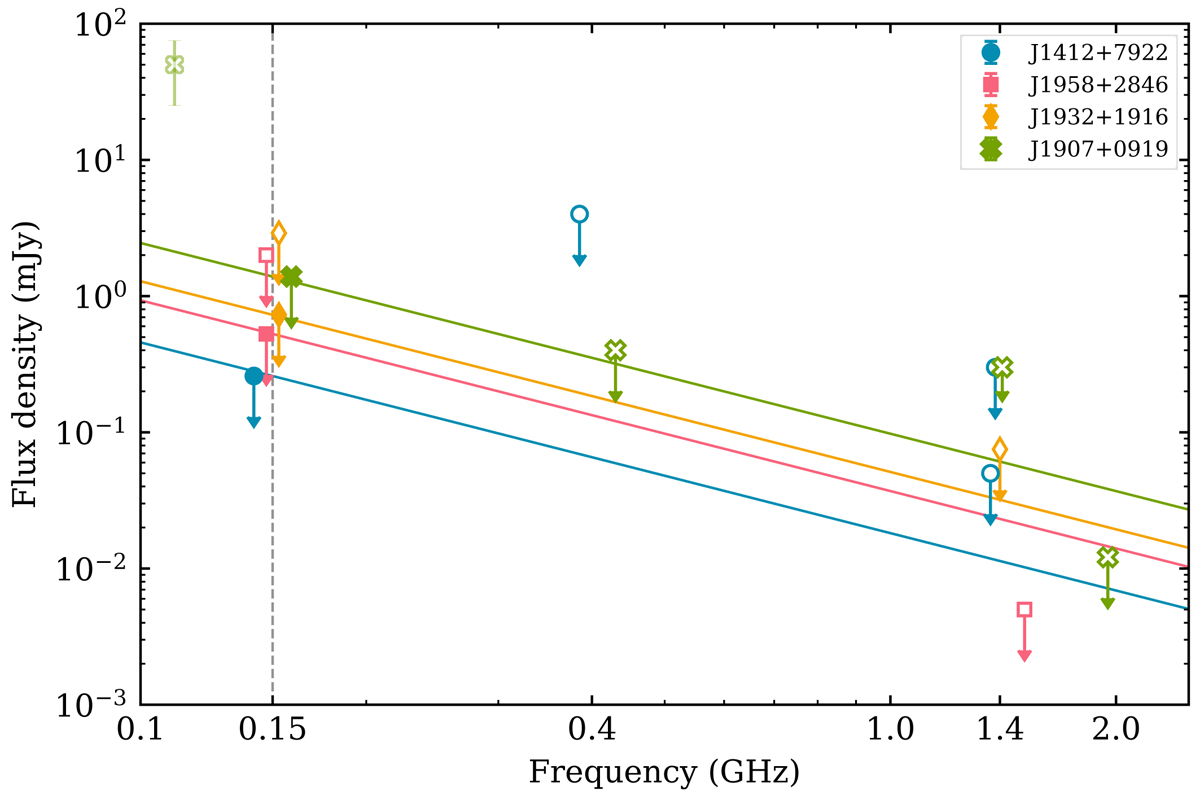
Fig. 1.
Download original image
Flux density upper limits of this work at 150 MHz (filled symbols) with S/N = 5 for comparison to earlier searches of the same sources (empty symbols). Solid lines going through our upper limit estimates with spectral index α = −1.4 are overlaid to show the scaling of our sensitivity limits. Our limits are plotted slightly offset from the 150 MHz observing frequency (dashed line) for better visibility. The faded green marker for SGR J1907+0919 represents the detection claimed by Shitov et al. (2000).
Current usage metrics show cumulative count of Article Views (full-text article views including HTML views, PDF and ePub downloads, according to the available data) and Abstracts Views on Vision4Press platform.
Data correspond to usage on the plateform after 2015. The current usage metrics is available 48-96 hours after online publication and is updated daily on week days.
Initial download of the metrics may take a while.