Open Access
Fig. 2.
Download original image
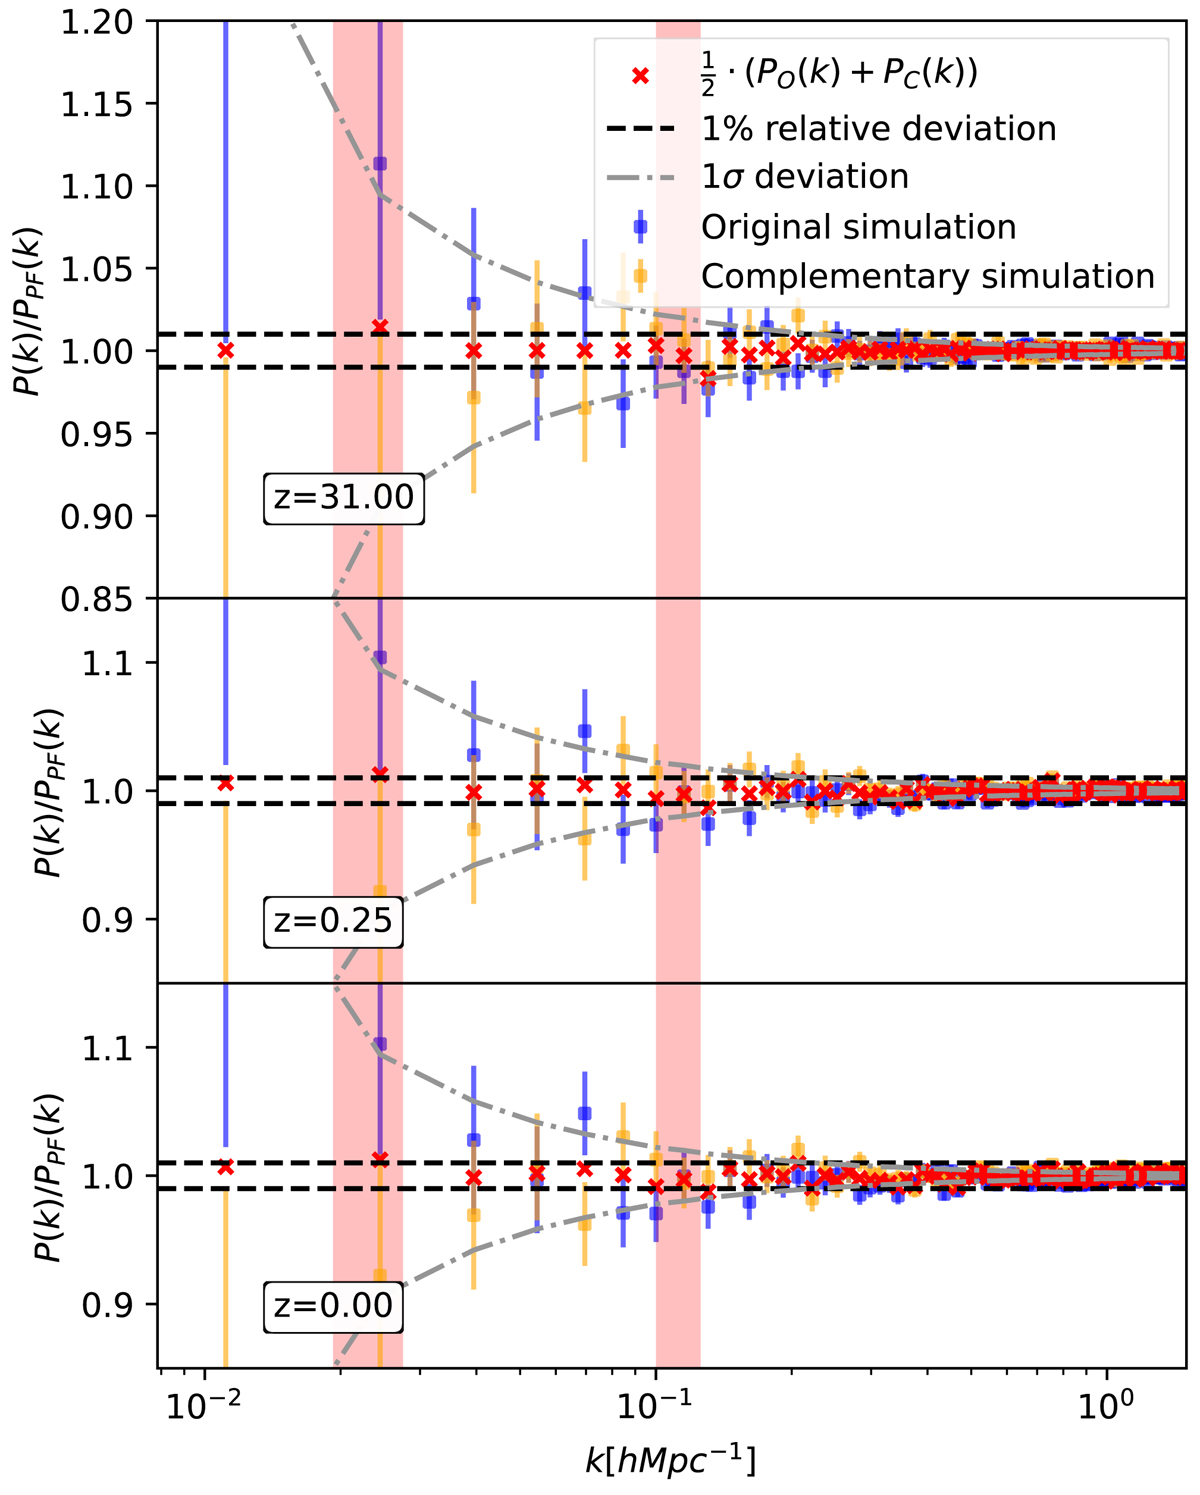
Ratio of the O–C and PF power spectra in the L = 800 Mpc h−1 simulation set. The red shaded regions show the ranges where uncompensated modes were present in the complementary simulation. Although these modes were not fully compensated in the average, we included these in the ![]() statistics plotted in Fig. 1.
statistics plotted in Fig. 1.
Current usage metrics show cumulative count of Article Views (full-text article views including HTML views, PDF and ePub downloads, according to the available data) and Abstracts Views on Vision4Press platform.
Data correspond to usage on the plateform after 2015. The current usage metrics is available 48-96 hours after online publication and is updated daily on week days.
Initial download of the metrics may take a while.