Open Access
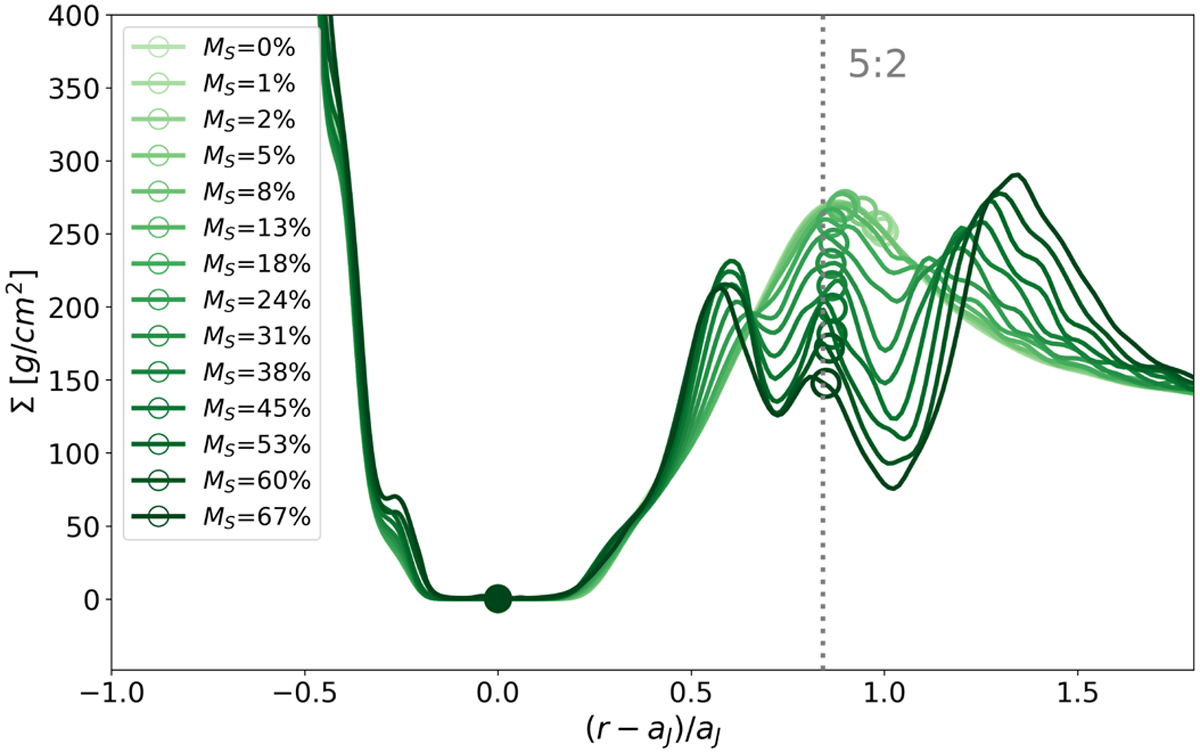
Fig. 7
Download original image
Radial density profiles of simulation C in the time interval [45 500, 60 000] yr. The green colour gradient corresponds to a time evolution (and therefore also a mass evolution for Saturn) from light to dark. The filled and empty circles indicate the positions of Jupiter and Saturn.
Current usage metrics show cumulative count of Article Views (full-text article views including HTML views, PDF and ePub downloads, according to the available data) and Abstracts Views on Vision4Press platform.
Data correspond to usage on the plateform after 2015. The current usage metrics is available 48-96 hours after online publication and is updated daily on week days.
Initial download of the metrics may take a while.